


Introduced in 1969 by Clive Granger, Granger causality test is a statistical test that is used to determine if a particular time series is helpful in forecasting another series.
What is Granger Causality?
Let’s first understand when is the Granger causality test is useful.
Let’s say you have two time series data X and Y, and you want to know if X is useful in predicting the Y. Then you can use Granger causality test to determine this.
This is often used in Vector Autogregression (VAR) method of forecasting.
Although we are testing if a variable X is causal to Y, we are not exactly testing the true cause-and-effect relationship between two variables.
That’s because, in many occasions, correlation does not necessarily imply causation. We only test if X (and lags of X) is helpful in explaining Y, and thereby help forecasting it. So we are not concerned about the true causal relationship between the variables. That’s why say “X Granger causes Y”. instead of just “X causes Y”.
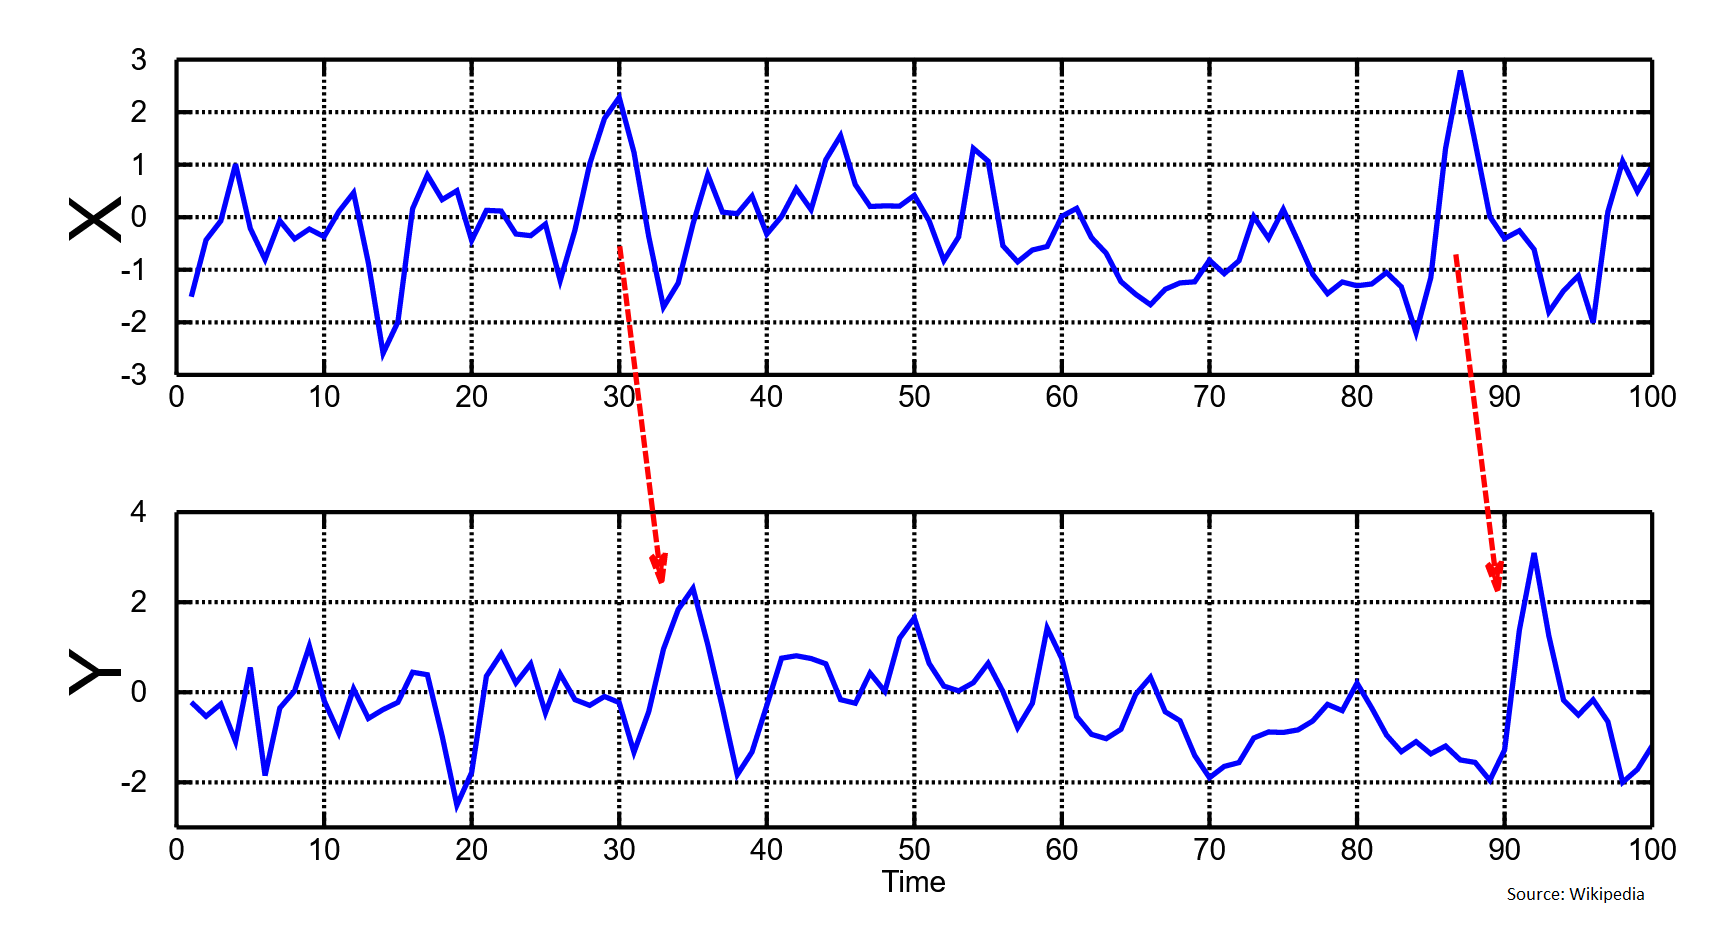
Often you can see this effect visually as well, where the Y follows some of the patterns that X has after a time delay.
How to perform the test?
The null hypothesis (H0) for the test assumes that the lagged values of X (where the number of lags is usually specified by the user) do not explain the variance in Y.
That is, H0 is lags of X do not Granger cause Y.
This can be formulated as follows, where you try to explain Y as a function of the lags of Y and lags of the X variable.
The alphas are the coefficients of the lags of Y and the betas are the coefficients of the lags of X.

So technically, the null hypothesis is as follows:
H0: β1 = β2 = . . . = βm = 0

But how do we know how many lags of X and Y should be included in the equation?
This involves two aspects.
First, find out the number of lags of Y to include.

Include as many lags that are individually significant based on the p-values (or t-statistic).
Then, keep as many lags of Y and on top of it add the lags of X.

In this equation, retain as many lags of X that are individually significant.
Another approach to find the optimal value of ‘n’ is to try building models with various values of ‘n’, and choose the model that produces the lowest value of AIC / BIC scores.
Important Assumption
The Granger’s causality test assumes that the X and Y are stationary time series. That is the statistical properties such as the mean and variance do not change with time.
If any of the series is not stationary, it must first be made stationary, typically using differencing or any other transformation.
Reference
Cromwell, J. et. al. (1994) Multivariate Tests for Time Series Models, Issue 100. Sage University.

