DataFrame is a 2 dimensional mutable data structure, that is used for handling tabular data. Unlike Arrays and Matrices, a DataFrame can hold columns of different data types
The DataFrames package in Julia provides the DataFrame object which is used to hold and manipulate tabular data in a flexible and convenient way. It is quite essential for master DataFrames in order to perform data analysis, building machine learning models and other scientific computing.
In this tutorial, I explain how to work with DataFrames in Julia.
Content
- Install DataFrames package in Julia
- Create New DataFrame
- Import Data
- Data Exploration
- Indexing the DataFrame
- Summarizing the DataFrame
- Join DataFrames
- Export DataFrames
1. Install DataFrames package in Julia
You can install any package in Julia with Pkg.add() command. Let’s install DataFrames in Julia
using Pkg
Pkg.add("DataFrames")
2. Create new dataframe
In Julia, You can create a DataFrame in multiple ways:
(i) Using a single statement using DataFrame()
(ii) Column by column
(iii) Row by row
(i) Create new dataframe in a single statement
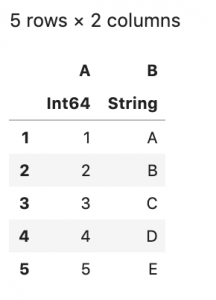
You can create one using the DataFrame() function by enclosing the column names and values inside it. To do that you need to first load the DataFrames package by writing using DataFrames before using the function.
using DataFrames

df = DataFrame(A = 1:5, B = ["A", "B", "C", "D", "E"])
(ii) Create new dataframe column by column
Alternately, You can create an empty Julia DataFrame using DataFrame() function and then add columns one by one.
Since DataFrames are mutable, you can modify them afterward as well.
# Initialize Empty DataFrame
df = DataFrame()

# Add Columns
df.A = 1:5

df.B = ["A", "B", "C", "D", "E"]

df

(iii) Create new dataframe row by row
Create an empty Julia DataFrame by enclosing column names and datatype of column inside DataFrame() function.
Now you can add rows one by one using push!() function. This is like row binding.
# Initialize empty DataFrame with columns
df = DataFrame(A = Int[], B = String[])

# Add Rows
push!(df, (1, "A"))
push!(df, (2, "B"))
push!(df, (3, "C"))
push!(df, (4, "D"))
push!(df, (5, "E"))

df

3. Import Data
You have seen how to create DataFrames. Now, let’s see how to import the existing files inside Julia as a DataFrame.
There are different ways to import a dataset file. Let’s go through 2 of the most popular one.
(i) Using readtable()
(ii) Using CSV package
3.1 Using readtable() function from DataFrames package
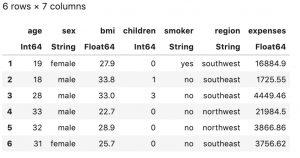
readtable() function is used to read data from a CSV-like file
# Import data using readtable
using DataFrames
df = readtable("Data/insurance.csv")
head(df)
3.2 Using CSV package and later on converting the file to DataFrame
Read the file with CSV.File() function. Now, covert it to a DataFrame using DataFrame function
# Add "CSV" package
using Pkg
Pkg.add("CSV")
# Read the file using CSV.File and convert it to DataFrame
using CSV
df = DataFrame(CSV.File("Data/insurance.csv"))
head(df)

4. Data Exploration
Now, once you know how to read and create DataFrames, how about exploring it a bit. Let’s see some useful examples.
4.1 Show all rows and columns of DataFrame
By default, Julia doesn’t print all the rows and columns of a DataFrame because of obvious reasons like space and storage issues. But if you want to see all the rows and columns, it’s possible using show() function with allrows & allcols arguments.
# Show all rows of DataFrame
show(df, allrows=true)

# Show all columns of DataFrame
show(df, allcols=true)
I am not printing it here because of space constraints. But trust me, it works.
4.2 Show top/bottom rows of DataFrame
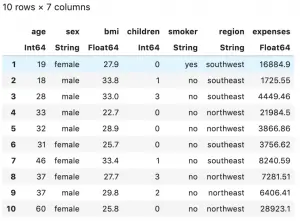
head & first functions are used to see top n rows of a DataFrame
# Print first n rows of df
head(df, 10)

first(df, 10)
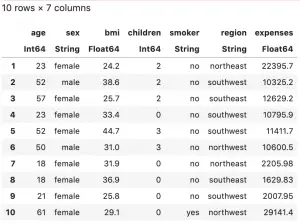
tail & last functions are used to see bottom n rows of a DataFrame
# Print last n rows of df
tail(df, 10)

last(df, 10)
4.3 Size of DataFrame
The size function is used to see the size of a DataFrame. By size, I mean the number or rows and columns of the DataFrame.
# Shape and size of the data
println(size(df))

# Summary function also serves the purpose
println(summary(df))
4.4 Get column names of DataFrame
names function is used to get the column names of a DataFrame
# Shape and size of the data
names(df)
4.5 Description of DataFrame
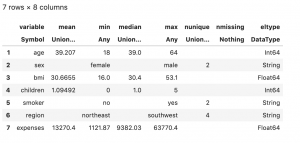
describe functions is used to get the description of a DataFrame. It tells us about matrices like the variable type, mean, median, max, number of unique values, number of missing values of every column in the DataFrame.
# Describe the data
describe(df)
5. Indexing and filtering the DataFrame (multiple methods)
Julia follows “1 based indexing” i.e the first element starts with 1. R programming is also a 1 based indexing language, while Python is a 0 based indexing language.
Selecting specific rows
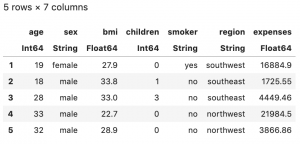
Rows and columns in DataFrame can be indexed by enclosing the index number inside [] big brackets.
# Select specific rows in the data
df[1:5,:]
Selecting specific rows and columns
When you want to index all the rows/columns, : colons are used. Likewise, I have used to index all columns in the above example.
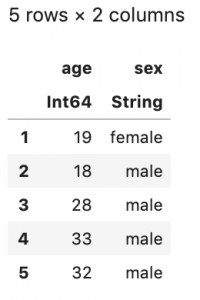
Julia follows the name based indexing as well i.e. specify the column name while indexing followed by : colon.
# Select specific rows and columns by column names in the data
df[1:5,[:age,:sex]]
# Select only one column, as a dataframe
df[1:5, [:age]]
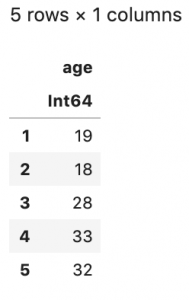
You must have noticed, I have used another [] square brackets in the column indexed space/area. This is required if you want to get a DataFrame. But, if you wish to get a vector, you need to remove the [] square brackets. Let’s see it with an example
# Select only one column, as a vector
df[1:5,:age]
#> Returns a vector
You can use select function as well to subset the data .
# Select columns using select() function
first(select(df, :age),5)

# Select all the column except "age" column
first(select(df, Not(:age)),5)
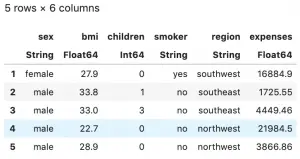
You can subset the data based on the values as well. You need to use a . operator before the less than/greater than/ equal to operators. Let’s see it with an example
# Filter based on values. Select all the rows where age is greater than 20.
first(df[df.age .> 20,:],5)
6. Grouping and Summarizing Data
You can group and summarize the data using aggregate function. You need to specify the aggregating operation you want to perform. Let’s see it with examples. I am going to get the sum and product of all the values in the columns.
# Subset the numeric columns
num_df = df[:,[:age,:bmi,:children,:expenses]]

# Aggregate the data to find sum of all the column values
println(aggregate(num_df, sum), "\n\n")

# Aggregate the data to find product of all the column values
println(aggregate(num_df, prod))
You can get the basic summary of any of the columns using describe function. I have explained it earlier as well.
# summarize data
describe(df[!,[:age]])

! can also be used in place of : when you wish to index all the values.
7. Join Data
Using join function, you can join multiple DataFrames to create a single DataFrame based on a common column .
You can specify the type of join you wish to perform. Be it inner, left, right, outer, self join.
# Define 2 datasets
employee_df = DataFrame(emp_code = ["N_1", "N_2", "N_3", "N_4"],
emp_name = ["Kabir", "Aryan", "Khushi", "Mehak"])

designation_df = DataFrame(emp_code = ["N_1", "N_2", "N_3"],
emp_designation = ["Data Scientist", "Data Engineer", "VP"])

# Create a new DataFrame by joining the two DataFrames, primary key being "emp_code"
join(employee_df, designation_df, on = :emp_code)
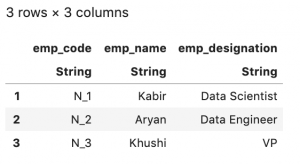
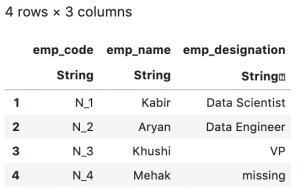
By default, it’s an inner join. Let’s see how to perform a left join
# left join
join(employee_df, designation_df, on = :emp_code, kind = :left)
8. Export DataFrames
writetable function is used to export the data.
writetable("output.csv", df)
Conclusion
So, now you should have a fair idea of how to handle DataFrames in Julia. Next, I will see you with more Data Science oriented topics in Julia.
Read more about Julia here


