Probability, as a concept, plays an instrumental role in the world of data science. When we talk about probability, we’re essentially talking about quantifying the uncertainty or the chance of an event occurring. One term that often finds its way in probability is ‘odds’. Odds can be somewhat counterintuitive, especially for those who are familiar with statistics and data science. Along with odds, the term ‘odds ratio’ also important, especially in logistic regression.

In this Blog post we will learn:
- What are Odds?
- What is the Odds Ratio?
2.1. Illustrative example - Why are Odds and Odds Ratios Important in Data Science?
- Diving Deeper: Interpretation, Assumptions, and Limitations
4.1. Interpreting the OR
4.2. Key Assumptions
4.3. Limitations - Practical Tips
- Conclusion
1. What are Odds?
Odds represent the ratio of the likelihood of an event occurring to it not occurring. In the context of a simple probability ( P ):
$ \text{Odds}(A) = \frac{P(A)}{1 – P(A)} $
Where:
– $ P(A) $ is the probability of event $A$ occurring
– $ 1 – P(A) $ is the probability of event $A$ not occurring
Example: Consider a dice roll. The probability of rolling a 3, $ P(3) $, is 1/6. Using the formula, the odds of rolling a 3 are:
$ \text{Odds}(3) = \frac{1/6}{5/6} = \frac{1}{5} $
This means that for every 1 time we roll a 3, we expect not to roll it 5 times.
2. What is the Odds Ratio?
The Odds Ratio (OR) is a measure of association between an exposure and an outcome. It tells us the odds of an event happening in one group compared to another.
Mathematically:
$ OR = \frac{\text{Odds in Group A}}{\text{Odds in Group B}} $
The odds ratio is also a backbone metric in logistic regression, a popular algorithm in data science for binary classification problems.
Example: Consider a clinical trial where we’re assessing the effectiveness of a drug. Let’s say:
– The odds of recovery with the drug (Group A) are 5 to 1.
– The odds of recovery without the drug (Group B) are 2 to 1.
The odds ratio would then be:
$ OR = \frac{5/1}{2/1} = 2.5 $
This indicates that the odds of recovery are 2.5 times higher with the drug than without it.
2.1. Illustrative example
Let’s consider a hypothetical case of a clinical trial comparing two treatments: Treatment A and Treatment B. The outcome is the recovery from a certain disease.
Here’s a contingency table of the data:
                 | Recovered | Not Recovered |
---------------------------------------------
Treatment A      |   70      |     30        |
---------------------------------------------
Treatment B      |   40      |     60        |
From this data, we can calculate the odds of recovery for both treatments and the odds ratio.
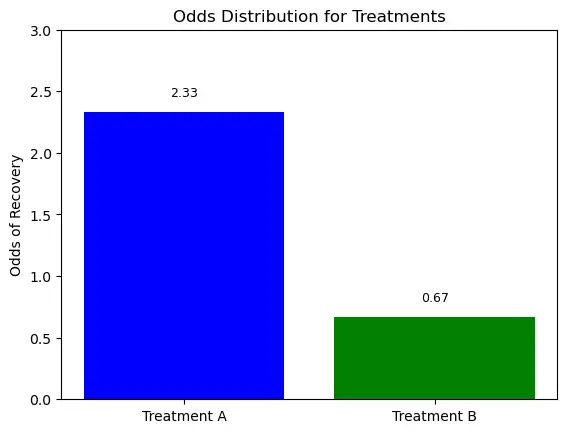
The odds for Treatment A = 70/30 = 7/3.
The odds for Treatment B = 40/60 = 2/3.
The odds ratio = (Odds for Treatment A) / (Odds for Treatment B) = (7/3) / (2/3) = 7/2 = 3.5.
This indicates that the odds of recovery are 3.5 times higher with Treatment A than with Treatment B.
To plot the odds distribution, we will represent the odds of both treatments on a bar chart.
Here’s how to do this in Python using the matplotlib library:
import matplotlib.pyplot as plt

# Sample data
treatments = ['Treatment A', 'Treatment B']
odds = [7/3, 2/3]  # calculated odds for both treatments

# Plot
plt.bar(treatments, odds, color=['blue', 'green'])
plt.ylabel('Odds of Recovery')
plt.title('Odds Distribution for Treatments')
plt.ylim(0, 3)
for i, v in enumerate(odds):
    plt.text(i, v + 0.1, "{:.2f}".format(v), ha='center', va='bottom', fontsize=9)
plt.show()

3. Why are Odds and Odds Ratios Important in Data Science?
- Logistic Regression: This is a go-to method for binary classification problems in data science. The outcome of logistic regression is the log odds. When you exponentiate the output, you get the odds ratio. This gives you a multiplicative factor by which the odds of the outcome increase for a one-unit increase in the predictor, holding other predictors constant.
-
Model Interpretability: Odds and odds ratios allow for a more interpretable way of understanding the relationship between predictors and the response variable. For instance, saying “the odds of success increase by a factor of 2 for every unit increase in X” is more intuitive than delving deep into raw probabilities.
-
Comparing Two Probabilities: Often in data science, we’re interested in comparing the probabilities between two groups. Odds ratios make this comparison straightforward.
-
No Bounds: Unlike probabilities which are bound between 0 and 1, odds can range from 0 to infinity. This can sometimes make them more amenable to certain types of statistical modeling.
4. Diving Deeper: Interpretation, Assumptions, and Limitations
4.1. Interpreting the OR
- OR = 1: Equal odds between groups; no association.
- OR > 1: Higher odds of the event in the first group.
- OR < 1: Lower odds of the event in the first group.
4.2. Key Assumptions
- Binary Outcome: OR suits binary outcome variables.
- Independence: Each observation must be independent.
- Rare Outcome Assumption: OR approximates relative risk, especially in rare outcomes.
4.3. Limitations
- Lacks Intuitiveness: “Odds” can be less intuitive than “probability.”
- Marginal Distributions: OR is influenced by the variables’ marginal distributions.
- Not a Probability: You can’t directly derive probability from OR.
5. Practical Tips
- Consider illustrating OR with intuitive terms or examples for non-technical audiences.
- Be wary about inferring causation from observational studies.
- Always factor in the broader context. Statistical significance might not equate to practical significance.
6. Conclusion
Odds and odds ratios are fundamental concepts in probability, statistics, and by extension, data science. Having a solid grasp of these ideas is crucial, especially if you’re dealing with logistic regression or any other modeling technique that revolves around binary outcomes.
Data science is all about drawing meaningful insights from data, and these concepts provide a more interpretable way to understand and communicate those insights.


