Let’s understand what are outliers, how to identify them using IQR and Boxplots and how to treat them if appropriate.
1. What are outliers?
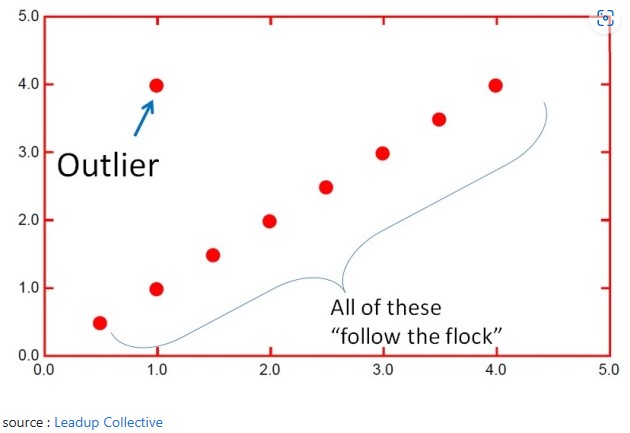
In statistics, outliers are those specific data points that differ significantly from other data points in the dataset.
There can be various reasons behind the outliers. It can be because of some event or some experimental/data entry error. Outliers are usually categorized as either point or pattern outliers.
Point outliers are the one which are single instances/datapoints of something abnormal, on the other hand pattern outliers are the clusters of instances/datapoints of something abnormal.
2. Why should you treat the outliers?
Outliers present in the data can cause various problems:
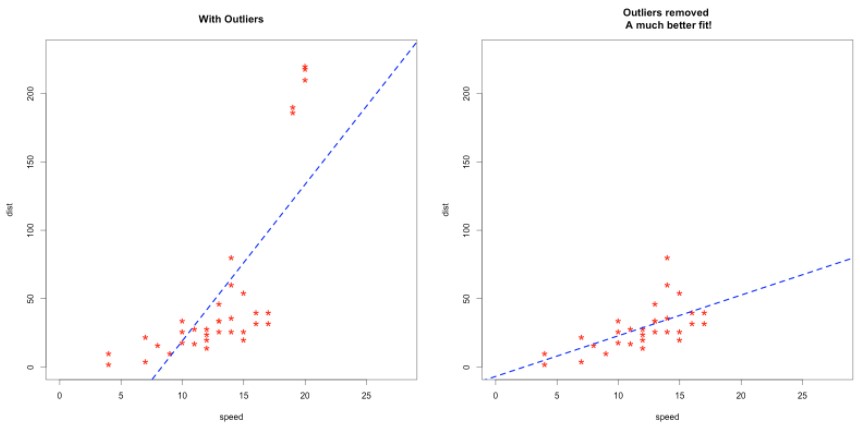
- Outliers might force the algorithm to fit the model away from the true relationship. Various algorithms work on minimizing the error/cost function, which can change because of outliers. The image below shows the impact.
-
They can affect the various statistics and significance tests you might do on the data. For example, it can impact the correlation you calculate between two numeric variables. So, it is a good practice to treat / remove outliers before you calculate correlations.
Note: Outliers are not necessarily a bad thing to have in the data. Sometimes these are just observations that are not following the same pattern than the other ones.
But it can also be the case that an outlier is very interesting for Science.
For example, if in a vaccination experiment, a person is infected with COVID-19 whereas all other vaccinated people are immune to COVID-19, then it would be very interesting to understand why. This could lead to new scientific discoveries. So, it is important to detect outliers.
So whenever you do identify outliers, don’t simply remove or treat them. Maybe such extreme data points can occur again? then consider including those datapoints in your data and let ML learn from them.
3. Detecting Outliers using Box and Whisker Plot
Box Plot is the visual representation to see how a numerical data is spread. It can also be used to detect the outlier.
It captures the summary of the data efficiently with a simple box and whiskers and allows us to compare data distribution easily across groups.

So how to spot outliers in a box plot?
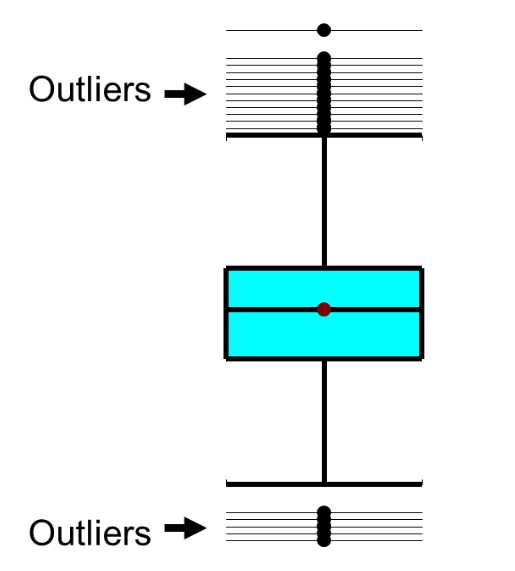
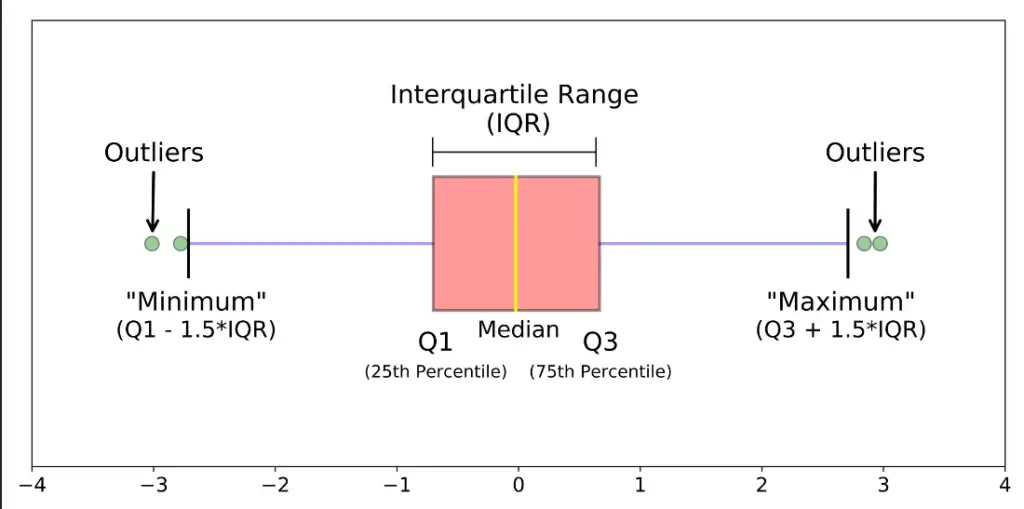
Those points that lie outside the whiskers are generally considered as outliers. Where, the whiskers are placed at a distance of 1.5 times the Interquartile Range (IQR) from the edge of the respective box. IQR is nothing but the difference between 3rd quartile and the 1st quartile.
Usually the outlier datapoints are marked as dots in the box plot.
Import Data
The only packages we need for this are numpy and pandas for data wrangling, and matplotlib and seaborn for visualization.
# Import libraries
import matplotlib.pyplot as plt
import seaborn as sns

# Data Manipulation
import numpy as np
import pandas as pd

# Set pandas options to show more rows and columns
pd.set_option('display.max_rows', 800)
pd.set_option('display.max_columns', 500)
%matplotlib inline
Load dataset
Let’s define the numeric and categorical columns.
# Target class name
input_target_class = "Exited"

# Columns to be removed
input_drop_col = "CustomerId"

# Categorical columns
input_cat_columns = ['Surname', 'Geography', 'Gender', 'Gender', 'HasCrCard', 'IsActiveMember', 'Exited']

# Numerical columns
input_num_columns = ['CreditScore', 'Age', 'Tenure', 'Balance', 'NumOfProducts', 'EstimatedSalary']
Now, import the dataset as pandas dataframe.
# Read data in form of a csv file
df = pd.read_csv("Churn_Modelling.csv")

# First 5 rows of the dataset
df.head()
| RowNumber | CustomerId | Surname | CreditScore | Geography | Gender | Age | Tenure | Balance | NumOfProducts | HasCrCard | IsActiveMember | EstimatedSalary | Exited | |
|---|---|---|---|---|---|---|---|---|---|---|---|---|---|---|
| 0 | 1 | 15634602 | Hargrave | 619 | France | Female | 42 | 2 | 0.00 | 1 | 1 | 1 | 101348.88 | 1 |
| 1 | 2 | 15647311 | Hill | 608 | Spain | Female | 41 | 1 | 83807.86 | 1 | 0 | 1 | 112542.58 | 0 |
| 2 | 3 | 15619304 | Onio | 502 | France | Female | 42 | 8 | 159660.80 | 3 | 1 | 0 | 113931.57 | 1 |
| 3 | 4 | 15701354 | Boni | 699 | France | Female | 39 | 1 | 0.00 | 2 | 0 | 0 | 93826.63 | 0 |
| 4 | 5 | 15737888 | Mitchell | 850 | Spain | Female | 43 | 2 | 125510.82 | 1 | 1 | 1 | 79084.10 | 0 |
Draw boxplot for all columns one by one
Iterate over each column and draw boxplot for each.
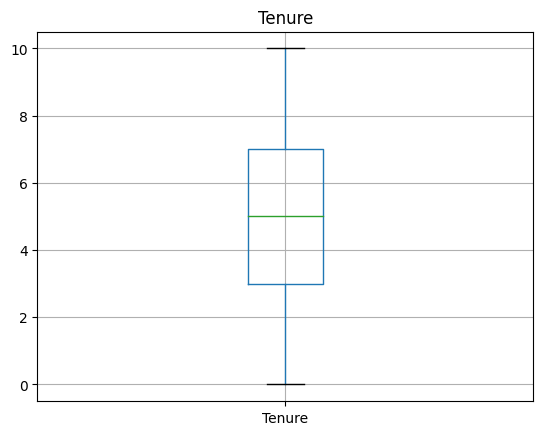
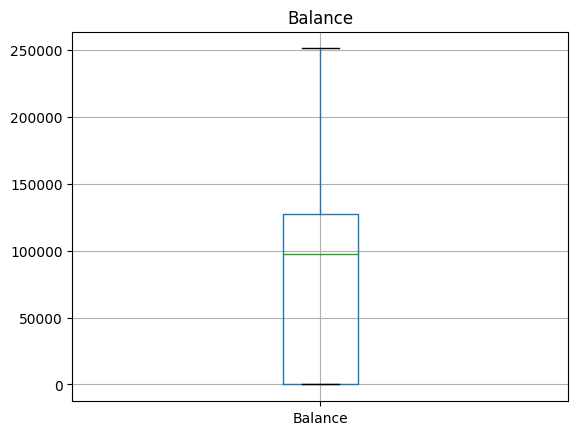
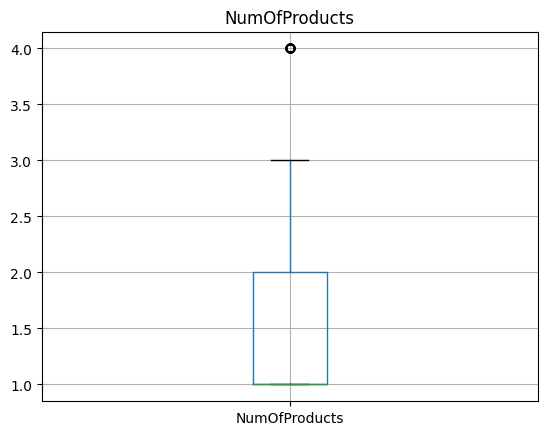
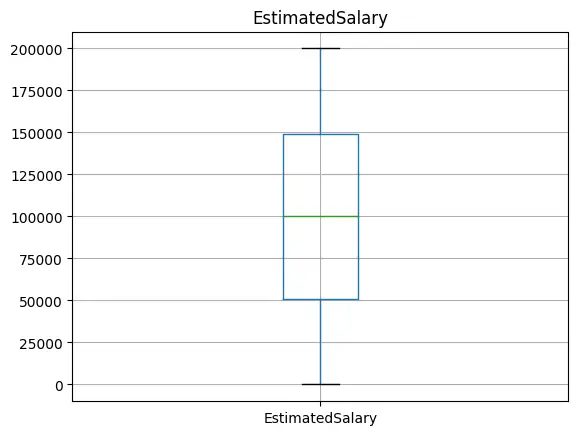
# Draw boxplot for each numeric column.
for column in df:
    if column in input_num_columns:
        plt.figure()
        plt.gca().set_title(column)
        df.boxplot([column])
Inference
Outliers are visible for ‘Number of Products’, ‘Age’ and ‘Credit Score’.
Draw boxplot for all columns at once using seaborn
df.head()
| RowNumber | CustomerId | Surname | CreditScore | Geography | Gender | Age | Tenure | Balance | NumOfProducts | HasCrCard | IsActiveMember | EstimatedSalary | Exited | |
|---|---|---|---|---|---|---|---|---|---|---|---|---|---|---|
| 0 | 1 | 15634602 | Hargrave | 619 | France | Female | 42 | 2 | 0.00 | 1 | 1 | 1 | 101348.88 | 1 |
| 1 | 2 | 15647311 | Hill | 608 | Spain | Female | 41 | 1 | 83807.86 | 1 | 0 | 1 | 112542.58 | 0 |
| 2 | 3 | 15619304 | Onio | 502 | France | Female | 42 | 8 | 159660.80 | 3 | 1 | 0 | 113931.57 | 1 |
| 3 | 4 | 15701354 | Boni | 699 | France | Female | 39 | 1 | 0.00 | 2 | 0 | 0 | 93826.63 | 0 |
| 4 | 5 | 15737888 | Mitchell | 850 | Spain | Female | 43 | 2 | 125510.82 | 1 | 1 | 1 | 79084.10 | 0 |
4. Compare Boxplots side by side, against each class of the target variable.
We can do this with seaborn using sns.boxplot.
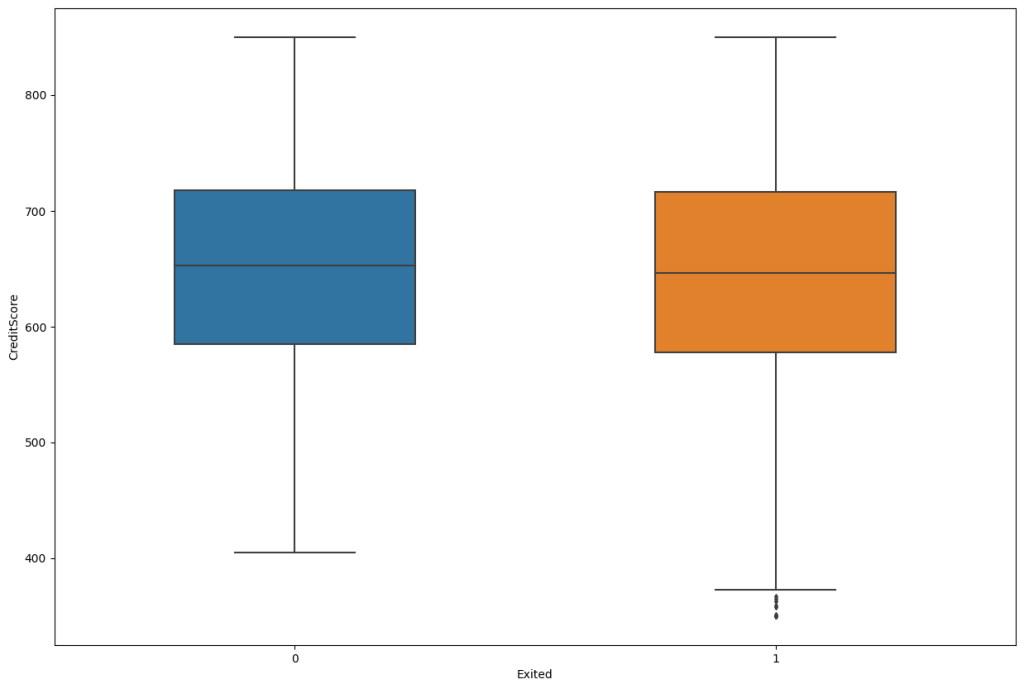
Credit Score
fig, ax = plt.subplots(figsize=(15,10))
sns.boxplot(data=df, width= 0.5, ax=ax,  fliersize=3, y="CreditScore", x="Exited");
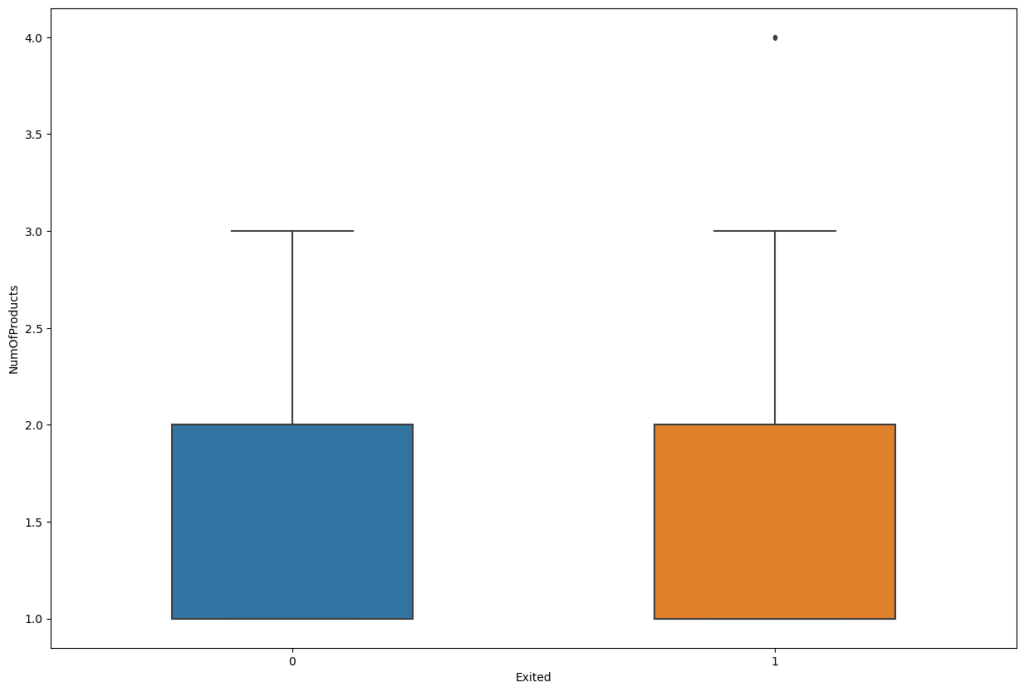
Number of products
fig, ax = plt.subplots(figsize=(15,10))
sns.boxplot(data=df, width= 0.5, ax=ax,  fliersize=3, y="NumOfProducts", x="Exited");
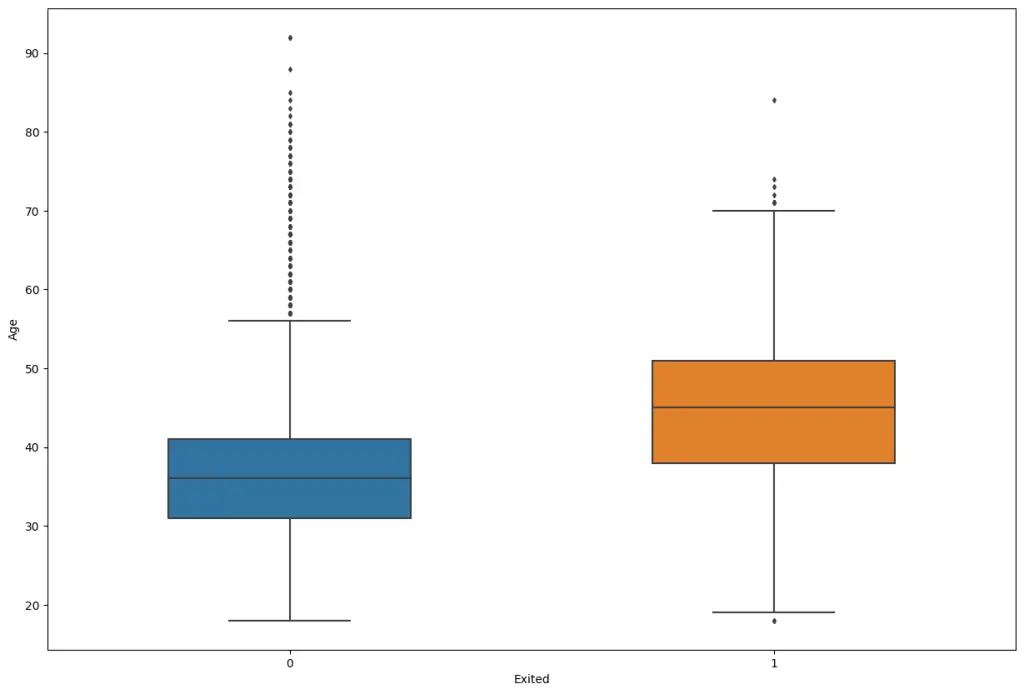
Age
fig, ax = plt.subplots(figsize=(15,10))
sns.boxplot(data=df, width= 0.5, ax=ax,  fliersize=3, y="Age", x="Exited");
Inferences:
- By observing the above boxplot you can manually detect the outlier values.
- Example: In the above boxplots Credit score contains more outlier values compared to others.
Let’s find these points mathematically, not visually. Let’s look at Interquartile Range (IQR)
5. Outlier Detection using Interquartile Range (IQR)
The interquartile range (IQR) is a measure of stastical dispersion which is equal to the difference between 1st and 3rd quartile. It’s basically first quartile subtracted from the third quartile.
IQR = Q₃ − Q₁
How to detect outliers now IQR?
All the values above Q3 + 1.5*IQR and the values below Q1 – 1.5*IQR are outliers. That’s basically all the points outside the whiskers.
Steps to perform Outlier Detection by identifying the lowerbound and upperbound of the data:
- Arrange your data in ascending order
- Calculate Q1 ( the first Quarter)
- Calculate Q3 ( the third Quartile)
- Find IQR = (Q3 – Q1)
- Find the lower Range = Q1 -(1.5 * IQR)
- Find the upper Range = Q3 + (1.5 * IQR)
Let’s find the outliers in the LSTAT feaure in boston df
# Sort the data
# data = boston_df.LSTAT
data = df.CreditScore
sort_data = np.sort(data)
sort_data
array([350, 350, 350, ..., 850, 850, 850], dtype=int64)
Find the 1st and 3rd quartiles.
# Find the 1st and 3rd quartiles
# We use the nanpercentile function to ignore the missing value just in case.
q1 = np.nanpercentile(data, 25, method='midpoint', )
q2 = np.nanpercentile(data, 50, method='midpoint')
q3 = np.nanpercentile(data, 75, method='midpoint')

IQR = q3 - q1
print('Interquartile range is', IQR)
Interquartile range is 134.0
Plot the boxplot
sns.boxplot(data=sort_data, width= 0.5, fliersize=3);
Calculate the upper and lower limit for outliers.
lower_limit = q1 - 1.5*(q3 - q1)
upper_limit = q3 + 1.5*(q3 - q1)
print(lower_limit)
print(upper_limit)

lower_limitoutliers = sort_data[sort_data < lower_limit]
upper_limitoutliers = sort_data[sort_data > upper_limit]
383.0
919.0
Let’s see the upper and lower limit outliers.
upper_limitoutliers
array([], dtype=int64)
lower_limitoutliers
array([350, 350, 350, 350, 350, 351, 358, 359, 363, 365, 367, 373, 376,
       376, 382], dtype=int64)
Inference:
So, Outliers are found only at the lower tail.
Treating Outliers
Optionally, you can replace the values outside the limits with respective threshold. But in this context, it’s not needed. So, I am commenting out the following code.
# sort_data[sort_data < lower_limit] = lower_limit
# sort_data[sort_data > upper_limit] = upper_limit


