


Let’s dive deep into how to identify and treat outliers in PySpark, a popular open-source, distributed computing system that provides a fast and general-purpose cluster-computing framework for big data processing.
Outliers are unusual data points that do not follow the general trend of a dataset. They can heavily influence the results of data analysis, predictive modeling, and machine learning algorithms.
Outliers can be classified into two categories:
- Univariate outliers: Anomalies present within a single variable.
-
Multivariate outliers: Anomalies present in the relationship between multiple variables.
Before handling outliers, it’s essential to understand their origin. They may arise due to data entry errors, measurement errors, or natural variation. Identifying the cause can help determine the appropriate treatment technique.
How to detect Outlier?
You can use several statistical methods to identify outliers. We’ll discuss two popular methods
1. IQR method:
The Interquartile Range (IQR) method detects outliers based on quartiles. The steps are as follows:
A) Calculate the first quartile (Q1) and the third quartile (Q3).
B) Compute the IQR (Q3 – Q1).
C) Determine the lower and upper bounds for outliers (Q1 – 1.5IQR and Q3 + 1.5IQR).
D) Identify data points outside these bounds as outliers.
2. Z-score method: The Z-score method measures how far a data point is from the mean, expressed in terms of standard deviations. A high absolute Z-score indicates an outlier. The threshold for identifying outliers is typically set at 2 or 3.
The formula for calculating the Z score of a data point x is:
Z = (x – μ) / σ
where:

- x is the data point
-
μ (mu) is the mean (average) of the dataset
-
σ (sigma) is the standard deviation of the dataset
Determine a threshold for outliers, usually in terms of the number of standard deviations away from the mean. A common threshold is +/- 2 or 3 standard deviations, depending on how conservative or aggressive you want to be in identifying outliers.
This means that any data point with a Z score less than -2 or greater than 2 (or -3 and 3, if using a more conservative threshold) would be considered an outlier.
How to Treat Outliers?
1. Capping and Flooring : Replace the outliers with the lower and upper bounds, effectively capping and flooring the extreme values
2. Winsorization : Similar to capping and flooring, Winsorization replaces the extreme values but uses percentiles instead of quartiles to determine the bounds
3. Dropping Outliers : Remove the rows containing outliers
4. Imputation : Replace the outlier values with the mean or median of the non-outlier values
1. Import required libraries and initialize SparkSession
First, let’s import the necessary libraries and create a SparkSession, the entry point to use PySpark.
import findspark
findspark.init()

from pyspark import SparkFiles
from pyspark.sql import SparkSession

spark = SparkSession.builder.appName("Outlier Detection and Treatment in PySpark").getOrCreate()
2. Preparing the Sample Data
To demonstrate the Variable type Identification, we’ll use a sample dataset. First, let’s load the data into a DataFrame
url = "https://raw.githubusercontent.com/selva86/datasets/master/Churn_Modelling_m.csv"
spark.sparkContext.addFile(url)

df = spark.read.csv(SparkFiles.get("Churn_Modelling_m.csv"), header=True, inferSchema=True)
df.show(2, truncate=False)
+---------+----------+--------+-----------+---------+------+---+------+--------+-------------+---------+--------------+---------------+------+
|RowNumber|CustomerId|Surname |CreditScore|Geography|Gender|Age|Tenure|Balance |NumOfProducts|HasCrCard|IsActiveMember|EstimatedSalary|Exited|
+---------+----------+--------+-----------+---------+------+---+------+--------+-------------+---------+--------------+---------------+------+
|1        |15634602  |Hargrave|619        |France   |Female|42 |2     |0.0     |1            |1        |1             |101348.88      |1     |
|2        |15647311  |Hill    |608        |Spain    |Female|41 |1     |83807.86|1            |0        |1             |112542.58      |0     |
+---------+----------+--------+-----------+---------+------+---+------+--------+-------------+---------+--------------+---------------+------+
only showing top 2 rows
3. Detect Continuous Variables in the Data
As Quartiles can we computed only for the continuous variables, It is mandatory to detect the continuous variables in the DataFrame before detecting and treating outliers
you can use the dtypes property to access the data types of each column, and then check if the data type is a numerical one. Continuous variables are usually represented as float or double data types.
from pyspark.sql.types import IntegerType, StringType, NumericType
from pyspark.sql.functions import approxCountDistinct

def detect_continuous_variables(df, distinct_threshold, drop_vars = []):
    continuous_columns = []
    for column in df.drop(*drop_vars).columns:
        dtype = df.schema[column].dataType
        if isinstance(dtype, (IntegerType, NumericType)):
            distinct_count = df.select(approxCountDistinct(column)).collect()[0][0]
            if distinct_count > distinct_threshold:
                continuous_columns.append(column)
    return continuous_columns
Call the detect_continuous_variables() function to identify the continuous variables in the data
This function will return a list containing the names of columns which are continuous in nature
continuous_variables = detect_continuous_variables(df, 10, ['RowNumber', 'CustomerId'])
print(continuous_variables)
['CreditScore', 'Age', 'Tenure', 'Balance', 'EstimatedSalary']
4. How to Detect and Treat Outliers using IQR method
The Interquartile Range (IQR) method detects outliers based on quartiles
from pyspark.sql.functions import col, exp
def iqr_outlier_treatment(dataframe, columns, factor=1.5):
    """
    Detects and treats outliers using IQR for multiple variables in a PySpark DataFrame.

    :param dataframe: The input PySpark DataFrame
    :param columns: A list of columns to apply IQR outlier treatment
    :param factor: The IQR factor to use for detecting outliers (default is 1.5)
    :return: The processed DataFrame with outliers treated
    """
    for column in columns:
        # Calculate Q1, Q3, and IQR
        quantiles = dataframe.approxQuantile(column, [0.25, 0.75], 0.01)
        q1, q3 = quantiles[0], quantiles[1]
        iqr = q3 - q1

        # Define the upper and lower bounds for outliers
        lower_bound = q1 - factor * iqr
        upper_bound = q3 + factor * iqr

        # Filter outliers and update the DataFrame
        dataframe = dataframe.filter((col(column) >= lower_bound) & (col(column) <= upper_bound))

    return dataframe
Calling the iqr_outlier_treatment() function
Execute the iqr_outlier_treatment fuinction to detect and treat the outliers automatically
df_outlier_treatment = iqr_outlier_treatment(df, continuous_variables, factor=1.5)
Convert data frames to Pandas Data frame for plotting and comparing the results
# Convert PySpark DataFrame to Pandas
pdDF_outlier_treatment = df_outlier_treatment.toPandas()
pdDF = df.toPandas()
#Concatenate both treated and untreated data contain continuous variables
test_df = pdDF[continuous_variables].join(pdDF_outlier_treatment[continuous_variables], rsuffix="_treated")
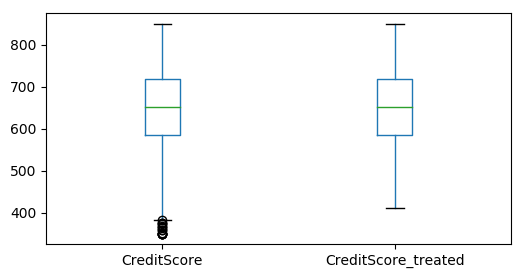
#Box plots for visually identyfy the impact
test_df.boxplot(column= ['CreditScore', 'CreditScore_treated'], grid=False, figsize=(6,3))

5. Hoow to detect and treat outliers using the z-score
let’s create a function that calculates the z-scores for each variable and then filters the outliers based on a given threshold
The threshold for identifying outliers is typically set at 2 or 3.
from pyspark.sql.functions import col, mean, stddev

def z_score_outlier_treatment(df, columns, threshold=3.0):
    """
    Detects and removes outliers from a PySpark DataFrame using the z-score method.

    :param df: PySpark DataFrame
    :param columns: list of column names for which outliers should be removed
    :param threshold: z-score threshold to determine outliers (default is 3.0)
    :return: PySpark DataFrame with outliers removed
    """
    for column in columns:
        # Calculate mean and standard deviation
        stats = df.select(mean(col(column)).alias('mean'), stddev(col(column)).alias('stddev')).collect()[0]

        # Calculate z-scores and filter outliers
        df = df.withColumn(f'{column}_z_score', (col(column) - stats['mean']) / stats['stddev']) \
               .filter(f'abs({column}_z_score) <= {threshold}') \
               .drop(f'{column}_z_score')

    return df
Calling the z_score_outlier_treatment() function
Execute the z_score_outlier_treatment fuinction to detect and treat the outliers automatically
df_outlier_treatment_Z = z_score_outlier_treatment(df, continuous_variables, threshold=2.5)
Convert data frames to Pandas Data frame for plotting and comparing the results
pdDF_outlier_treatment = df_outlier_treatment_Z.toPandas()
pdDF = df.toPandas()

#Concatenate both treated and untreated data contain continuous variables
test_df = pdDF[continuous_variables].join(pdDF_outlier_treatment[continuous_variables], rsuffix="_treated")

#Box plots for visually identyfy the impact
test_df.boxplot(column= ['CreditScore', 'CreditScore_treated'], grid=False, figsize=(6,3))
Conclusion
In this blog post, we have discussed how to identify and treat outliers in PySpark using the IQR and Z-score methods for detection and capping/flooring, Winsorization, dropping, and imputation techniques for treatment.
By incorporating these methods into your PySpark data processing workflow, you can ensure more robust and reliable results from your data analysis and machine learning models.

