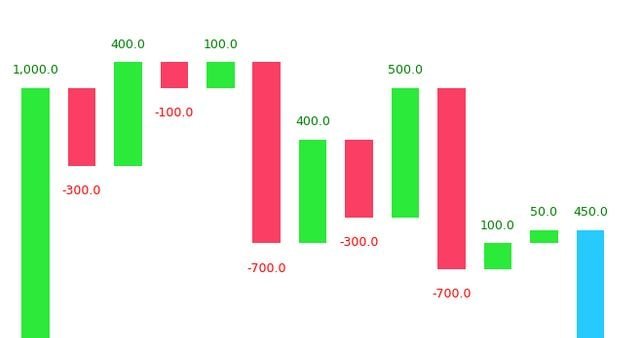
Matplotlib Tutorial – Principles of creating any plot with the Matplotlib library
Matplotlib is the most popular Python library to plot beautiful graphs. This tutorial guides you to grasp fundamental plotting through reproducible examples. Useful Posts: 1. Matplotlib Beginners Tutorial 2. Top 50 Matplotlib Plots for Data Analysis Overview This tutorial takes you through the following well-rounded concepts: 1. Plotting your first graph 2. Line style and …
Matplotlib Tutorial – Principles of creating any plot with the Matplotlib library Read More »


