Exploratory Data Analysis, simply referred to as EDA, is the step where you understand the data in detail.
You understand each variable individually by calculating frequency counts, visualizing the distributions, etc. Also the relationships between the various combinations of the predictor and response variables by creating scatterplots, correlations, etc.
EDA is typically part of every machine learning / predictive modeling project, especially with tabular datasets.
Why do EDA?
The above steps I’ve mentioned are quite common and be repeated for most projects. After all, the main objectives of EDA are:
- Understand which variables could be important in predicting the Y (response).
- Generate insights that give us more understanding of the business context and performance.
The main idea is to study the relationships between variables using various visualizations, statistical metrics (such as correlations) and significance tests, in the process, draw insights that may put the predictive modeling problem in context. Some of the insights can be eye-openers to your clients.
For example, in the Churn modeling problem we described earlier, it can be insightful to answer the following questions:
- It would be interesting to know if a particular age group (working class) is more prone to ‘Exit’?
- Does a higher CreditScore mean lower exit rates?
- Do younger people have higher CreditScores?
There can be many more. Let’s see some standard examples of how to go about performing EDA on the Churn modeling dataset.
This is a part of the ‘Your First Machine Learning Project‘ series.
We will use the Churn modeling dataset will continue where we left from the ML Modeling lesson.
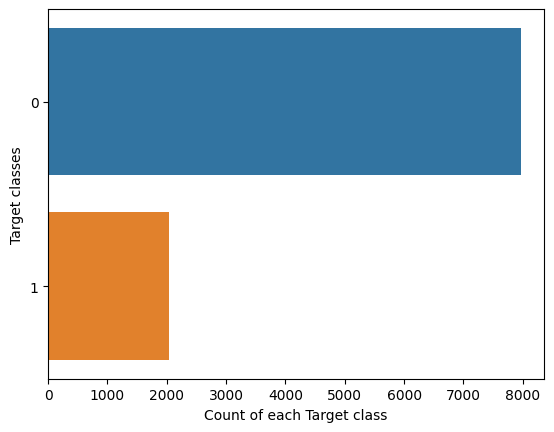
Example 1: Check frequency counts of Target
# Check distribution of target class
sns.countplot(y=df[input_target_class] ,data=df)
plt.xlabel("Count of each Target class")
plt.ylabel("Target classes")
plt.show()
# Value counts
print(df['Exited'].value_counts())
0    7963
1    2037
Name: Exited, dtype: int64
So, the number of people churned is about one-fifth of the total number. Though it’s quite high, there is a large class imbalance.
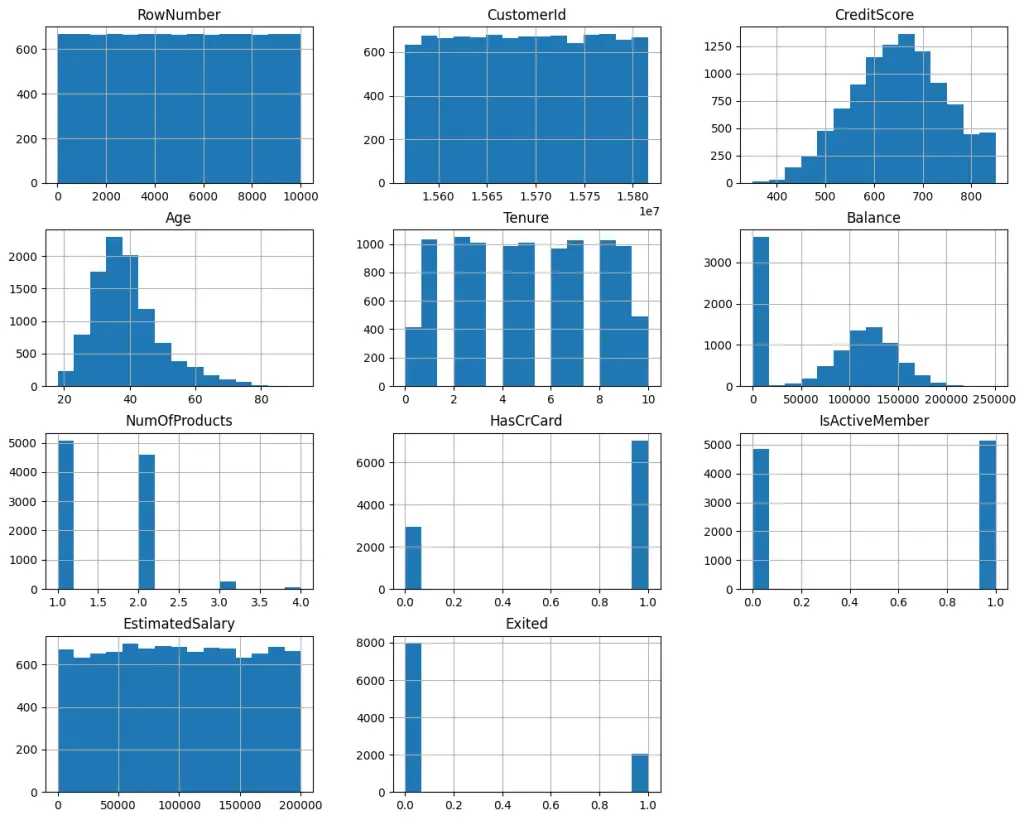
Example 2: Check distribution of every feature
# Check the distribution of all the features
df.hist(figsize=(15,12),bins = 15)
plt.title("Features Distribution")
plt.show()
Looking at the charts, it’s quite clear which values are discrete (NumofProducts, HasCreditCard, etc) and which ones are continuous. You can also see the shapes of the distributions.
Example 3: Check how different numerical features are related to target class
How to check if a numeric variable can be helpful in predicting a target class?
A numeric column will be more useful predictor, if there is a significant difference in mean of the target for the various values of the predictor.
The opposite it not necessarily true, that is, it does not mean it is not useful if such difference exists. There are be patterns that are not see, that can help improve the model predictions even when no visible mean difference is observed.
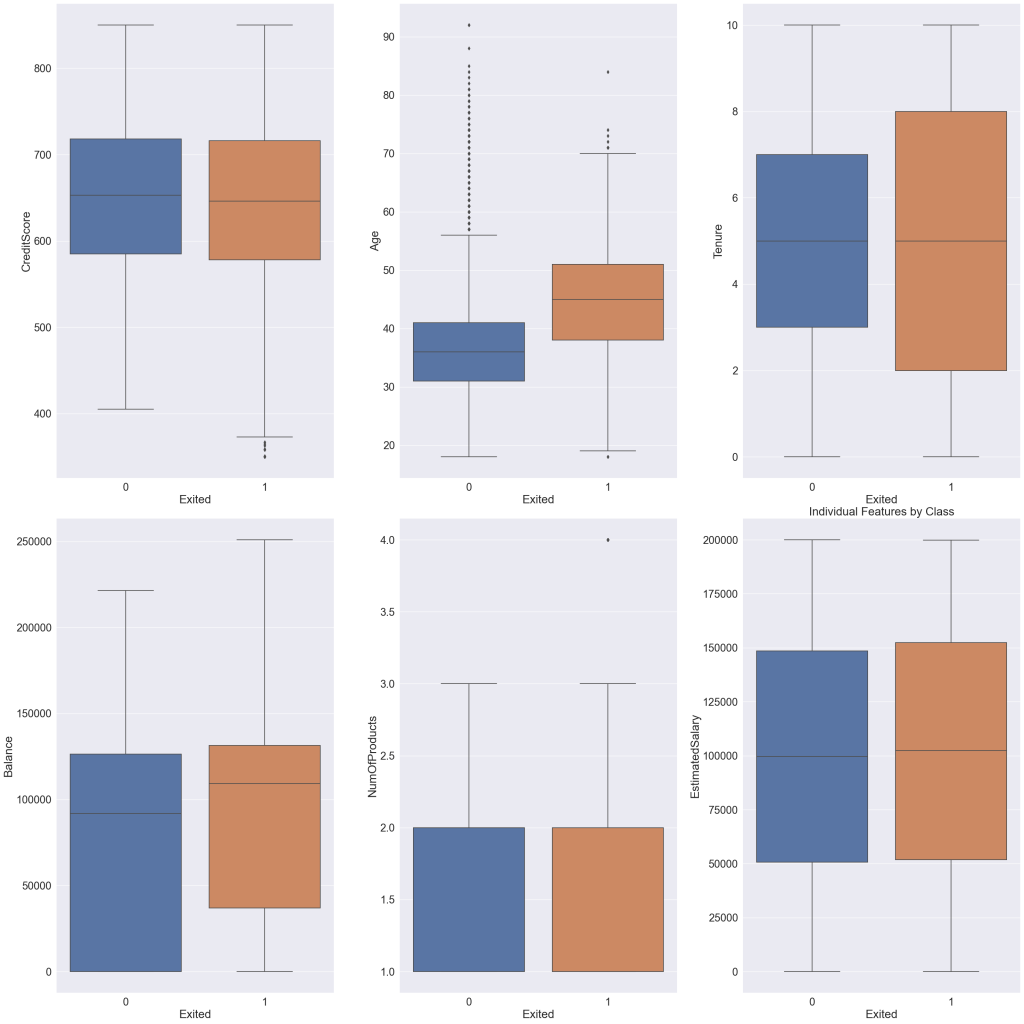
Let’s visualize usinga box plot.
Take a particular numeric predictor. Then, make a box plot for both the values of the target. A useful predictor will typically have a different position of the boxes and / or the size of the boxes will be different.
# Number of rows and columns in the plot
n_cols = 3
n_rows = math.ceil(len(input_num_columns)/n_cols)
Increase font size globally.
sns.set(font_scale=2)
Plot boxplots one each value of the target, for each variable.
# Check the distribution of y variable corresponding to every x variable
fig,ax = plt.subplots(nrows = n_rows, ncols = n_cols, figsize=(30,30))
row = 0
col = 0
for i in input_num_columns:
    if col > 2:
        row += 1
        col = 0
    axes = ax[row,col]
    sns.boxplot(x = df[input_target_class], y = df[i], ax = axes)
    col += 1
plt.tight_layout()
plt.title("Individual Features by Class")
plt.show()
From the above plots, the position / size of the boxes are different for: Credit Score, Age, Tenure, Balance, Estimared Salary (to a certain extent).
So, these variables will probably be helpful in predicting the ‘Exited’ column.
It does not however mean that if the boxes are similar positions, they are not useful.
Example 4: Comparing distributions with Joy plots (density plots)
!pip install joypy
!python -c "import joypy; print(joypy.__version__)"
0.2.6
Draw joyplots, one for each continuous variable. Visually different density curves imply the variable is likely useful to predict the Y (Exited).
# Visualize / compare distributions
import joypy
varbls = ['Age','Tenure','CreditScore','Balance', 'EstimatedSalary']

plt.figure(figsize=(10,2), dpi= 80)
for i,var in enumerate(varbls):
    joypy.joyplot(df, column=[var], by="Exited", ylim='own', figsize=(16,5), color=['tomato', 'purple']);
    plt.title(f"{var} by 'Exited'", fontsize=22)
plt.show()
Example 5: Scatter matrix to visualize the relationships
Scatterplot matrix is useful when you have both the X and the Y variables to be numeric variables. In this case, we have the y variable (Exited) to be binary categorical.
Nevertheless, it can be interesting to see how two numeric predictor variables are related.
If two numeric variables are correlated (that is as one increases, the other one increases as well), it’s possible that they both contribute the some overlapping information (redundant) that may be helpful in explaining (predicting) the Y.
Reset font size
sns.set(font_scale=1)
Example: Pairplot with scatter option
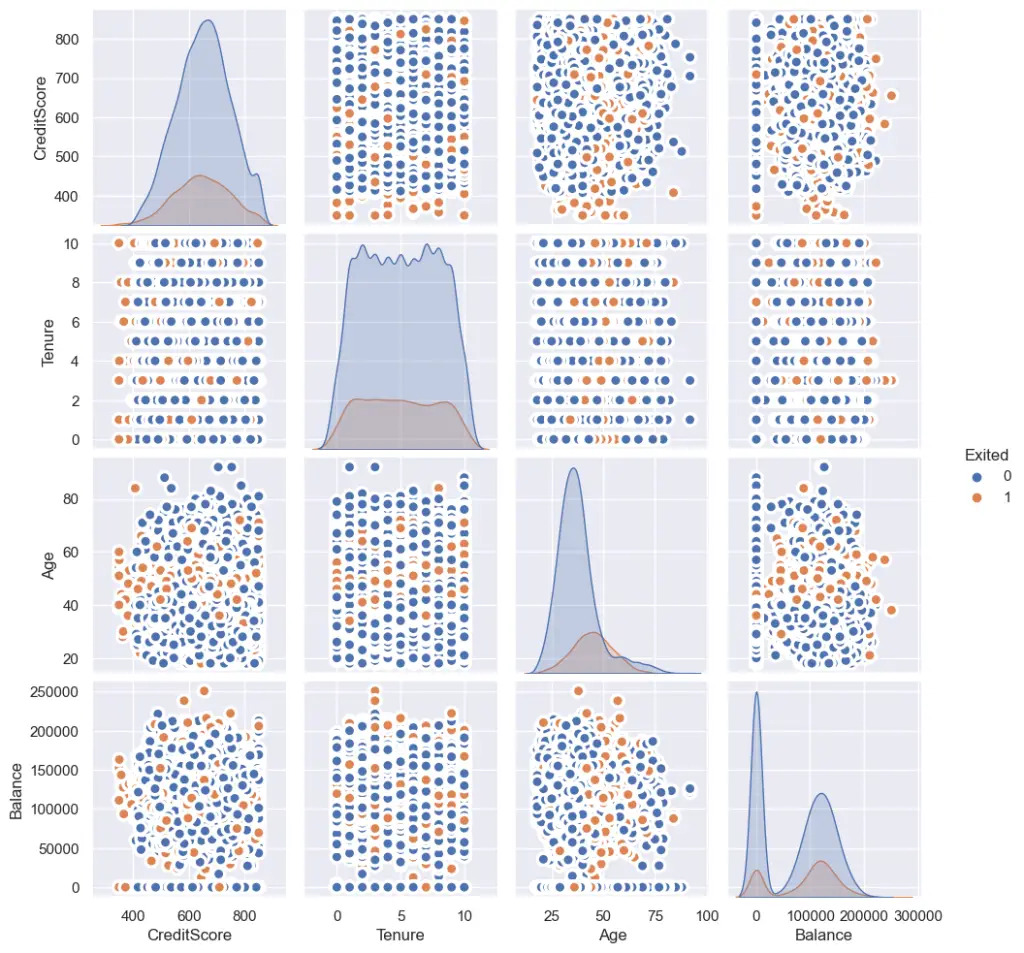
If a variable is a strong predictor, there usually will be a significant clustering of points.
Why does clustering and patterns indicate the predictors are useful?
Because, it signififies that for certain range of values between the two variables, the points tend to be of one particular class of Y.
This reveals the ‘interaction effect’ between two plotted variables.
For example, in the below chart, you can see the clustering occurring in regions of “CreditScore” vs “Age”. Also, in “Balance” vs “Age”. That means, points located in that region, tend to belong to that particular class.
Sometimes, this can be quite useful in coming up new features, such as ‘CreditScore/Age’.
# pairplot with seaborn library
plt.figure(figsize=(10,8), dpi= 80)
sns.pairplot(df.loc[:, ['Exited', 'CreditScore', 'Tenure', 'Age', 'Balance']],
             kind="scatter", hue="Exited", plot_kws=dict(s=80, edgecolor="white", linewidth=2.5))
plt.show()
Example: Pairplot with regression (‘reg’) option.
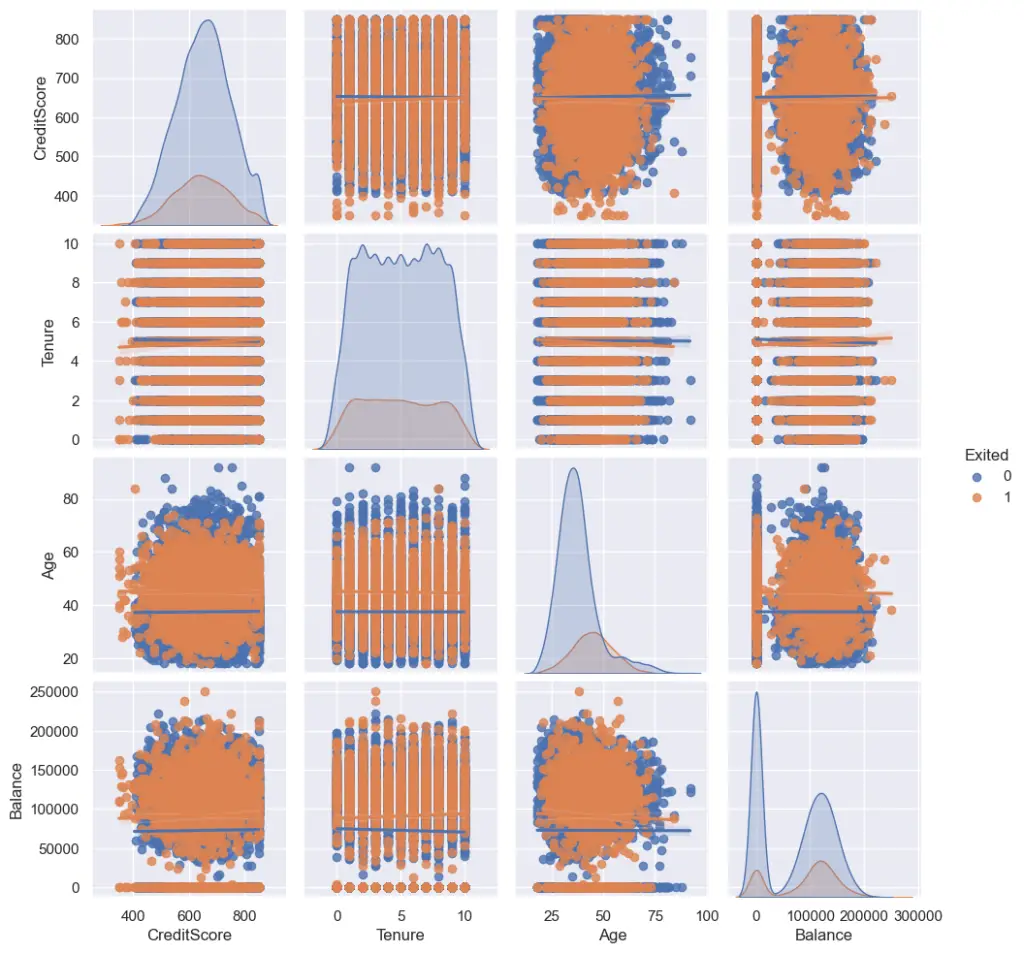
Pairplot provides a regression option as well. But this is of more use when both your predictor AND response are numeric variables, in which case the points in the scatter plot reveal the nature of the relationship between X and Y.
When X positively influence Y, the points will be distributed such that as X increases, Y also increases. The opposite applies for a negative relationship. Regardless, in both cases, where there is either a +ve or a -ve relationship, the X will be useful to predict the Y.
So when will X NOT be useful to predict y?
When the points are scattered completely random.
Ok. That’s the idea behind looking at scatterplots. I wanted to tell this for the sake of completeness. But, in our case, the Y is a categorical variable, so, this plot is not of much use here. Nevertheless, here is how it looks.
plt.figure(figsize=(10,8), dpi= 80)
sns.pairplot(df.loc[:, ['Exited', 'CreditScore', 'Tenure', 'Age', 'Balance']],
             kind="reg", hue="Exited")
plt.show()
Exercise
What kind of data summarization would you do to answer the 3 questions?
- Is any particular age group (working class) more prone to ‘Exit’?
- Does a higher CreditScore mean lower exit rates?
- Do younger people have higher CreditScores?
[Next] Lesson 6: Missing Data Imputation – How to handle missing values in Python


