


Lets dive into the concept of correlation, explore how to calculate it using PySpark in different ways, and discuss its applications in statistics and machine learning.
In the data-driven world we live in, correlation is a key concept that is frequently used in various fields, including statistics and machine learning. Understanding the relationship between variables is crucial for making predictions, uncovering hidden patterns, and optimizing processes.
What is Correlation?
Correlation is a statistical measure that quantifies the strength and direction of a linear relationship between two variables. It helps us understand if and how two variables move together. The correlation coefficient, denoted by ‘r’, ranges from -1 to 1,
where:
1) A value close to 1 signifies a strong positive relationship between the variables (as one variable increases, the other also increases).
2) A value close to -1 signifies a strong negative relationship between the variables (as one variable increases, the other decreases).
3) A value close to 0 signifies that there is no or very weak linear relationship between the variables.
Correlation Formula
r = Σ[(xi – x_mean)(yi – y_mean)] / [sqrt(Σ(xi – x_mean)^2) * sqrt(Σ(yi – y_mean)^2)]
Where:
Σ represents the sum of the values over all data points.
xi and yi are individual data points for variables X and Y, respectively.
x_mean and y_mean are the mean values of variables X and Y, respectively.
sqrt() denotes the square root function.
Uses of Correlation in Statistics and Machine Learning
1. Exploratory Data Analysis (EDA): Correlation analysis is often used during EDA to identify relationships between variables and generate hypotheses for further investigation.
2. Feature Selection: In machine learning, correlation can be used to identify multicollinearity – a situation where two or more predictor variables are highly correlated. Removing highly correlated features can help improve the model’s performance by reducing noise and overfitting.

3. Model Interpretability: Understanding the correlations between variables can help us make sense of the relationships in the data and interpret the results of machine learning models more effectively.
4. Causality Analysis: While correlation does not imply causation, it can be a valuable starting point for further investigation into causal relationships between variables.
5. Recommender Systems: Correlation is used in collaborative filtering algorithms to identify similar items or users based on their preferences, enabling personalized recommendations.
6. Time Series Analysis: In time series data, autocorrelation (correlation of a variable with itself at different time lags) and cross-correlation (correlation between two variables at different time lags) are crucial for understanding patterns and trends, as well as predicting future values.
7. Dimensionality Reduction: Techniques such as Principal Component Analysis (PCA) rely on correlation to identify linear combinations of variables that capture the maximum variance in the data while reducing dimensionality.
1. Import required libraries and initialize SparkSession
First, let’s import the necessary libraries and create a SparkSession, the entry point to use PySpark.
import findspark
findspark.init()

from pyspark import SparkFiles
from pyspark.sql import SparkSession
from pyspark.sql.functions import mean, stddev, col

spark = SparkSession.builder.appName("Correlation Example").getOrCreate()
2. Preparing the Sample Data
To demonstrate the different methods of calculating the Correlation, we’ll use a sample dataset containing three columns. First, let’s load the data into a DataFrame:
url = "https://raw.githubusercontent.com/selva86/datasets/master/Iris.csv"
spark.sparkContext.addFile(url)

df = spark.read.csv(SparkFiles.get("Iris.csv"), header=True, inferSchema=True)
df.show(5)
+---+-------------+------------+-------------+------------+-----------+
| Id|SepalLengthCm|SepalWidthCm|PetalLengthCm|PetalWidthCm|    Species|
+---+-------------+------------+-------------+------------+-----------+
|  1|          5.1|         3.5|          1.4|         0.2|Iris-setosa|
|  2|          4.9|         3.0|          1.4|         0.2|Iris-setosa|
|  3|          4.7|         3.2|          1.3|         0.2|Iris-setosa|
|  4|          4.6|         3.1|          1.5|         0.2|Iris-setosa|
|  5|          5.0|         3.6|          1.4|         0.2|Iris-setosa|
+---+-------------+------------+-------------+------------+-----------+
only showing top 5 rows
3. How to calculate Correlation Using DataFrame API
The first approach involves using the corr function from the DataFrame API.
# Calculate correlation
correlation = df.corr("SepalLengthCm", "PetalLengthCm")

print("Correlation between SepalLengthCm and PetalLengthCm :", correlation)
Correlation between SepalLengthCm and PetalLengthCm : 0.8717541573048717
4. How to calculate Correlation Using Using MLlib
MLlib is the machi ne learning library in PYspark, and it also provides a method to calculate correlation.
# Calculate Correlation Using Using MLlib
from pyspark.ml.stat import Correlation

# Assemble feature vector
# Define the feature and label columns & Assemble the feature vector
vector_assembler = VectorAssembler(inputCols=["SepalLengthCm", "SepalWidthCm", "PetalLengthCm", "PetalWidthCm"], outputCol="features")
data_vector = vector_assembler.transform(df).select("features")

# Calculate correlation
correlation_matrix = Correlation.corr(data_vector, "features").head()[0]

print("Correlation between SepalLengthCm and PetalLengthCm: ", correlation_matrix[0, 1])

print(correlation_matrix)
Correlation between SepalLengthCm and PetalLengthCm:  -0.10936924995064934
DenseMatrix([[ 1.        , -0.10936925,  0.87175416,  0.81795363],
             [-0.10936925,  1.        , -0.4205161 , -0.35654409],
             [ 0.87175416, -0.4205161 ,  1.        ,  0.9627571 ],
             [ 0.81795363, -0.35654409,  0.9627571 ,  1.        ]])
5. How to calculate Correlation Using RDD-based AP
For those who prefer working with RDDs, the RDD-based API provides a method to calculate correlation as well.
from pyspark.mllib.stat import Statistics
from pyspark.mllib.linalg import Vectors
import pandas as pd

# Select only numeric columns
columns = ["SepalLengthCm",  "SepalWidthCm", "PetalLengthCm", "PetalWidthCm"]
data = df.select(columns)

# Convert the DataFrame into an RDD of Vectors
rdd_vectors = data.rdd.map(lambda row: Vectors.dense(row))

# Calculate the Pearson correlation matrix using the RDD of Vectors
correlation_matrix = Statistics.corr(rdd_vectors, method="pearson")

correlation_df = pd.DataFrame(correlation_matrix, columns=columns, index=columns)
print("Correlation matrix:")
print(correlation_df)
Correlation matrix:
               SepalLengthCm  SepalWidthCm  PetalLengthCm  PetalWidthCm
SepalLengthCm       1.000000     -0.109369       0.871754      0.817954
SepalWidthCm       -0.109369      1.000000      -0.420516     -0.356544
PetalLengthCm       0.871754     -0.420516       1.000000      0.962757
PetalWidthCm        0.817954     -0.356544       0.962757      1.000000
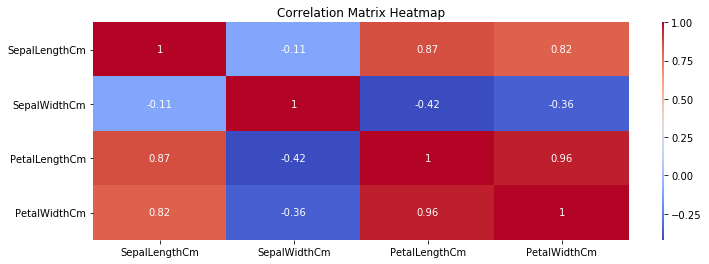
6. Generating correlation heat map using Correlation matrix
import seaborn as sns
import matplotlib.pyplot as plt
import pandas as pd

# Convert the correlation matrix to a Pandas DataFrame
correlation_df = pd.DataFrame(correlation_matrix, columns=columns, index=columns)

# Create the heatmap using Seaborn
plt.figure(figsize=(9, 3))
sns.heatmap(correlation_df, annot=True, cmap="coolwarm", cbar_kws={"aspect": 60})
plt.title("Correlation Matrix Heatmap")
plt.show()
Conclusion
Correlation is a fundamental concept in statistics and machine learning, providing insights into the relationships between variables.
In this blog post, we have explored the definition of correlation, demonstrated how to calculate it using PYspark in different ways, and discussed its various applications in statistics and machine learning.
Understanding and leveraging correlation can lead to better models, improved decision-making, and more effective data-driven strategies.

