One sample T-Test tests if the given sample of observations could have been generated from a population with a specified mean.
If it is found from the test that the means are statistically different, we infer that the sample is unlikely to have come from the population.
For example: If you want to test a car manufacturer’s claim that their cars give a highway mileage of 20kmpl on an average. You sample 10 cars from the dealership, measure their mileage and use the T-test to determine if the manufacturer’s claim is true.
By end of this, you will know when and how to do the T-Test, the concept, math, how to set the null and alternate hypothesis, how to use the T-tables, how to understand the one-tailed and two-tailed T-Test and see how to implement in R and Python using a practical example.

- Introduction
- Purpose of One Sample T Test
- How to set the null and alternate hypothesis?
- Use Cases
- Procedure to do One Sample T Test
- One Sample T Test Example
- One Sample T Test Implementation
- How to decide which T Test to perform? Two Tailed, Upper Tailed or Lower Tailed?
- Conclusion
- Related Posts
Introduction
The ‘One sample T Test’ is one of the 3 types of T Tests. It is used when you want to test if the mean of the population from which the sample is drawn is of a hypothesized value. You will understand this statement better (and all of about One Sample T test) better by the end of this post.
T Test was first invented by William Sealy Gosset, in 1908. Since he used the pseudo name as ‘Student’ when publishing his method in the paper titled ‘Biometrika’, the test came to be know as Student’s T Test.
Since it assumes that the test statistic, typically the sample mean, follows the sampling distribution, the Student’s T Test is considered as a Parametric test.
Purpose of One Sample T Test
The purpose of the One Sample T Test is to determine if a sample observations could have come from a process that follows a specific parameter (like the mean).
It is typically implemented on small samples.
For example, given a sample of 15 items, you want to test if the sample mean is the same as a hypothesized mean (population). That is, essentially you want to know if the sample came from the given population or not.
Let’s suppose, you want to test if the mean weight of a manufactured component (from a sample size 15) is of a particular value (55 grams), with a 99% confidence.
How did we determine One sample T-test is the right test for this?
Because, there is only one sample involved and you want to compare the mean of this sample against a particular (hypothesized) value..
To do this, you need to set up a null hypothesis and an alternate hypothesis.
How to set the null and alternate hypothesis?
The null hypothesis usually assumes that there is no difference in the sample means and the hypothesized mean (comparison mean). The purpose of the T Test is to test if the null hypothesis can be rejected or not.
Depending on the how the problem is stated, the alternate hypothesis can be one of the following 3 cases:
-
- Case 1: H1 : x̅ != µ. Used when the true sample mean is not equal to the comparison mean. Use Two Tailed T Test.
-
- Case 2: H1 : x̅ > µ. Used when the true sample mean is greater than the comparison mean. Use Upper Tailed T Test.
- Case 3: H1 : x̅ < µ. Used when the true sample mean is lesser than the comparison mean. Use Lower Tailed T Test.
Where x̅ is the sample mean and µ is the population mean for comparison. We will go more into the detail of these three cases after solving some practical examples.
Use Cases
Example 1: A customer service company wants to know if their support agents are performing on par with industry standards.
According to a report the standard mean resolution time is 20 minutes per ticket. The sample group has a mean at 21 minutes per ticket with a standard deviation of 7 minutes.
Can you tell if the company’s support performance is better than the industry standard or not?
Example 2: A farming company wants to know if a new fertilizer has improved crop yield or not.
Historic data shows the average yield of the farm is 20 tonne per acre. They decide to test a new organic fertilizer on a smaller sample of farms and observe the new yield is 20.175 tonne per acre with a standard deviation of 3.02 tonne for 12 different farms.
Did the new fertilizer work?
Procedure to do One Sample T Test
Step 1: Define the Null Hypothesis (H0) and Alternate Hypothesis (H1)
Example:
H0: Sample mean (x̅) = Hypothesized Population mean (µ)
H1: Sample mean (x̅) != Hypothesized Population mean (µ)
The alternate hypothesis can also state that the sample mean is greater than or less than the comparison mean.
Step 2: Compute the test statistic (T)
$$t = \frac{Z}{s} = \frac{\bar{X} – \mu}{\frac{\hat{\sigma}}{\sqrt{n}}}$$
where s is the standard error.
Step 3: Find the T-critical from the T-Table
Use the degree of freedom and the alpha level (0.05) to find the T-critical.
Step 4: Determine if the computed test statistic falls in the rejection region.
Alternately, simply compute the P-value. If it is less than the significance level (0.05 or 0.01), reject the null hypothesis.
One Sample T Test Example
Problem Statement:
We have the potato yield from 12 different farms. We know that the standard potato yield for the given variety is µ=20.
x = [21.5, 24.5, 18.5, 17.2, 14.5, 23.2, 22.1, 20.5, 19.4, 18.1, 24.1, 18.5]
Test if the potato yield from these farms is significantly better than the standard yield.
Solution:
Step 1: Define the Null and Alternate Hypothesis
H0: x̅ = 20
H1: x̅ > 20
n = 12. Since this is one sample T test, the degree of freedom = n-1 = 12-1 = 11.
Let’s set alpha = 0.05, to meet 95% confidence level.
Step 2: Calculate the Test Statistic (T)
1. Calculate sample mean
$$\bar{X} = \frac{x_1 + x_2 + x_3 + . . + x_n}{n}$$
$$\bar{x} = 20.175$$
- Calculate sample standard deviation
$$\bar{\sigma} = \frac{(x_1 – \bar{x})^2 + (x_2 – \bar{x})^2 + (x_3 – \bar{x})^2 + . . + (x_n – \bar{x})^2}{n-1}$$
$$\sigma = 3.0211$$
- Substitute in the T Statistic formula
$$T = \frac{\bar{x} – \mu}{se} = \frac{\bar{x} – \mu}{\frac{\sigma}{\sqrt{n}}}$$
$$T = (20.175 – 20)/(3.0211/\sqrt{12}) = 0.2006$$
Step 3: Find the T-Critical
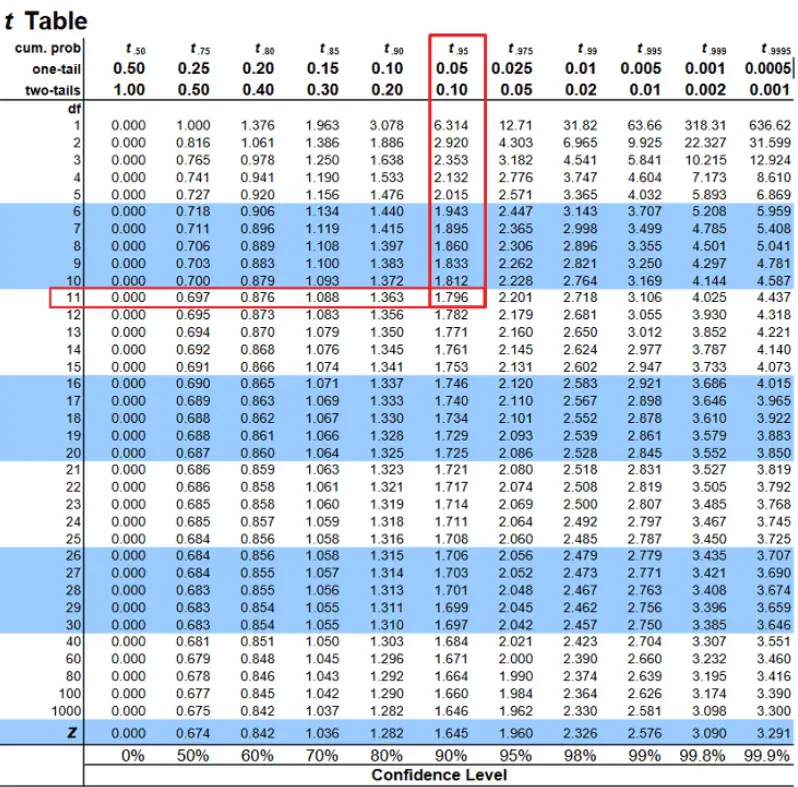
Confidence level = 0.95, alpha=0.05. For one tailed test, look under 0.05 column. For d.o.f = 12 – 1 = 11, T-Critical = 1.796.
Now you might wonder why ‘One Tailed test’ was chosen. This is because of the way you define the alternate hypothesis. Had the null hypothesis simply stated that the sample means is not equal to 20, then we would have gone for a two tailed test. More details about this topic in the next section.
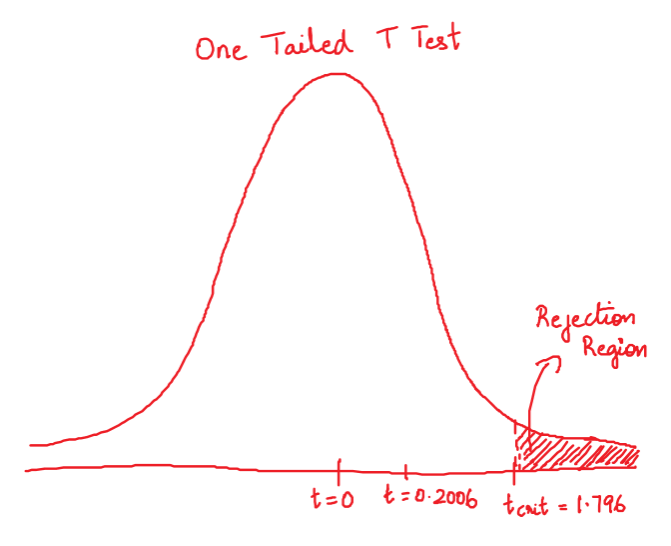
Step 4: Does it fall in rejection region?
Since the computed T Statistic is less than the T-critical, it does not fall in the rejection region.
Clearly, the calculated T statistic does not fall in the rejection region. So, we do not reject the null hypothesis.
One Sample T Test Implementation
In R
Since you want to perform a ‘One Tailed Greater than’ test (that is, the sample mean is greater than the comparison mean), you need to specify alternative='greater' in the t.test() function. Because, by default, the t.test() does a two tailed test (which is what you do when your alternate hypothesis simply states sample mean != comparison mean).
x <-  c(21.5, 24.5, 18.5, 17.2, 14.5, 23.2, 22.1, 20.5, 19.4, 18.1, 24.1, 18.5)
t.test(x=x, mu=20, alternative = 'greater')
#>     One Sample t-test

#> data:  x
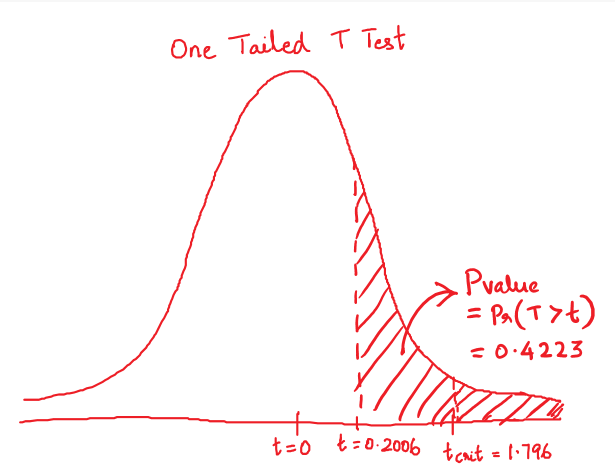
#> t = 0.20066, df = 11, p-value = 0.4223
#> alternative hypothesis: true mean is greater than 20
#> 95 percent confidence interval:
#>  18.60874      Inf
#> sample estimates:
#> mean of x
#>    20.175
The P-value computed here is nothing but p = Pr(T > t) (upper-tailed), where t is the calculated T statistic.
In Python
In Python, One sample T Test is implemented in ttest_1samp() function in the scipy package. However, it does a Two tailed test by default, and reports a signed T statistic. That means, the reported P-value will always be computed for a Two-tailed test. To calculate the correct P value, you need to divide the output P-value by 2.
Apply the following logic if you are performing a one tailed test:
For greater than test: Reject H0 if p/2 < alpha (0.05). In this case, t will be greater than 0.
For lesser than test: Reject H0 if p/2 < alpha (0.05). In this case, t will be less than 0.
from scipy.stats import ttest_1samp
x =  [21.5, 24.5, 18.5, 17.2, 14.5, 23.2, 22.1, 20.5, 19.4, 18.1, 24.1, 18.5]
tscore, pvalue = ttest_1samp(x, popmean=20)
print("t Statistic: ", tscore)
print("P Value: ", pvalue)
#> t Statistic:  0.2006562773994862
#> P Value:  0.8446291893053613
Since it is one tailed test, the real p-value is 0.8446/2 = 0.4223. We do not rejecting the Null Hypothesis anyway.
How to decide which T Test to perform? Two Tailed, Upper Tailed or Lower Tailed?
The decision of whether the computed test statistic falls in the rejection region depends on how the alternate hypothesis is defined.
We know the Null Hypothesis is H0: µD = 0. Where, µD is the difference in the means, that is sample mean minus the comparison mean.
You can also write H0 as: x̅ = µ, where x̅ is sample mean and ‘µ’ is the comparison mean.
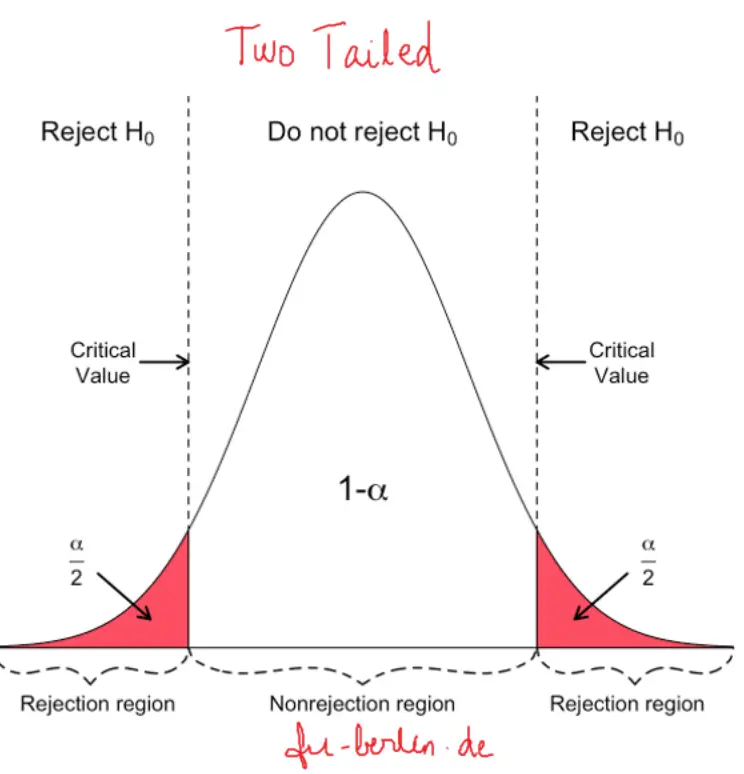
Case 1: If H1 : x̅ != µ, then rejection region lies on both tails of the T-Distribution (two-tailed). This means the alternate hypothesis just states the difference in means is not equal. There is no comparison if one of the means is greater or lesser than the other.
In this case, use Two Tailed T Test.
Here, P value = 2 . Pr(T > | t |)
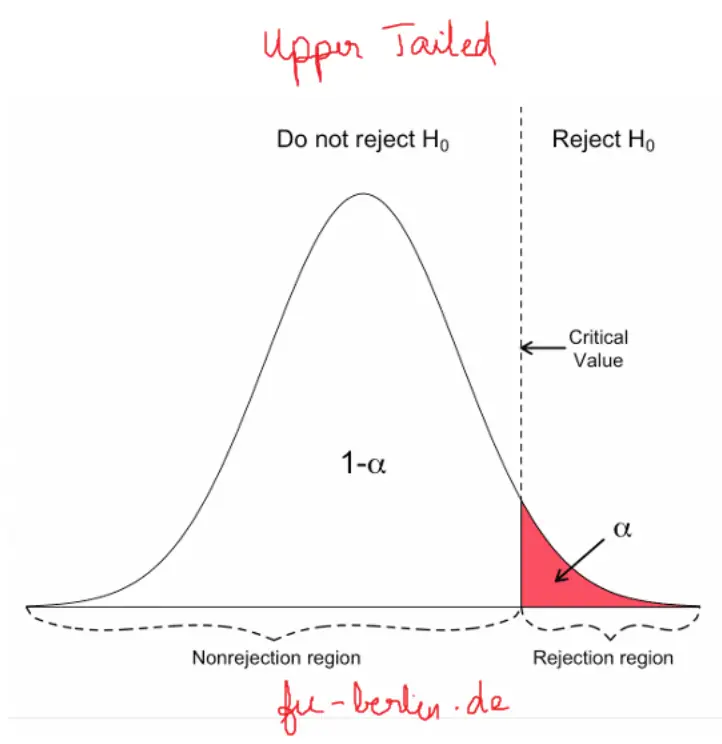
Case 2: If H1: x̅ > µ, then rejection region lies on upper tail of the T-Distribution (upper-tailed). If the mean of the sample of interest is greater than the comparison mean. Example: If Component A has a longer time-to-failure than Component B.
In such case, use Upper Tailed based test.
Here, P-value = Pr(T > t)
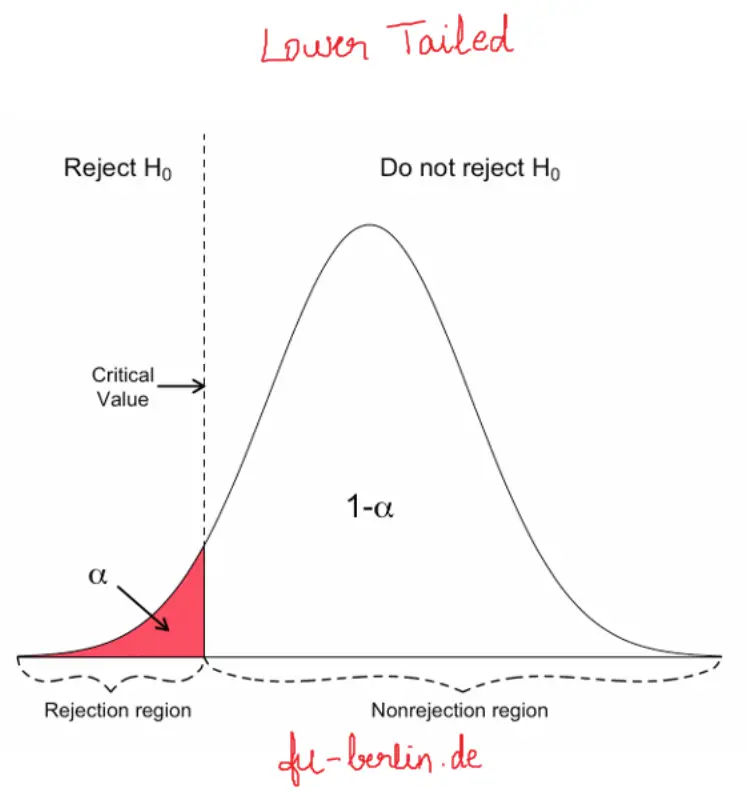
Case 3: If H1: x̅ < µ, then rejection region lies on lower tail of the T-Distribution (lower-tailed). If the mean of the sample of interest is lesser than the comparison mean.
In such case, use lower tailed test.
Here, P-value = Pr(T < t)
Conclusion
Hope you are now familiar and clear about with the One Sample T Test. If some thing is still not clear, write in comment. Next, topic is Two sample T test. Stay tuned.


