Statistics has a variety of tools to help us understand and interpret data. Two such tools are skewness and kurtosis, which give us insights into the shape of a data distribution.
Let’s dive deeper into these concepts and understand their significance.

In this blog post we will learn
- Skewness
1.1. Types of Skewness:
1.2. Rules of Thumb for Skewness:
1.3. Implications of Skewness: - Kurtosis
2.1. Types of Kurtosis:
2.2. Implications of Kurtosis: - Computing Skewness and Kurtosis
- Importance of Understanding Skewness and Kurtosis
- Conclusion
1. Skewness
Skewness measures the asymmetry of a data distribution. If you visualize your data using a histogram or frequency curve, skewness indicates which side of the distribution is more stretched out or elongated than the other, and which side has a tail.
1.1. Types of Skewness:
- Positive Skewness (Right-skewed): The right tail (larger values) is longer than the left tail (smaller values). The mean is greater than the median.
-
Negative Skewness (Left-skewed): The left tail (smaller values) is longer than the right tail (larger values). The mean is less than the median.
-
No Skewness: The distribution is symmetric. This does not necessarily mean the distribution is “normal”.
1.2. Rules of Thumb for Skewness:
- If skewness is less than -1 or greater than 1, the distribution is highly skewed.
- If skewness is between -1 and -0.5 or between 0.5 and 1, the distribution is moderately skewed.
- If skewness is between -0.5 and 0.5, the distribution is approximately symmetric.
The rule of thumb for skewness helps in providing a general guideline for interpreting its value, which indicates the symmetry of the data distribution. Although these guidelines can vary slightly depending on the source, here’s a commonly used interpretation:
- Positive Value: Positive skewness indicates a distribution that is skewed to the right. The right tail is longer or fatter than the left tail. If skewness is greater than 1, the distribution is highly skewed to the right. If it’s between 0.5 and 1, it might be moderately positively skewed.
-
Negative Value: Negative skewness indicates a distribution that is skewed to the left. In other words, the left tail is longer or fatter than the right tail. Commonly, if skewness is less than -1 or less, the distribution is highly skewed to the left. If it’s between -0.5 and -1, it might be moderately negatively skewed.
-
Near Zero: If the skewness is near 0, the data are fairly symmetrical. However, symmetry doesn’t necessarily imply “normality” (as in a normal distribution).
1.3. Implications of Skewness:
If the data is skewed, it may lead to potential biases in the analysis. In such cases, certain statistical techniques that assume data is normally distributed might not be appropriate.
2. Kurtosis
Kurtosis quantifies the sharpness of the peak and the thickness of the tails of a data distribution. In simpler words, it tells us about the extreme values in the tails.
2.1. Types of Kurtosis:
- Leptokurtic (Kurtosis > 3): Distributions with fatter tails and a sharper peak than the normal distribution. Higher susceptibility to outliers.
-
Platykurtic (Kurtosis < 3): Distributions with thinner tails and a more flattened peak than the normal distribution.
-
Mesokurtic (Kurtosis = 3): Distributions with similar kurtosis as the normal distribution.
(Note: The above values are based on the standard method of computing kurtosis, where the kurtosis of a normal distribution is defined as 3.)
2.2. Implications of Kurtosis:
A leptokurtic distribution has more frequent large jumps away from the mean than a normal distribution does. This can be a sign of volatility in financial contexts. Platykurtic distributions, on the other hand, tend to have values closer to the mean, indicating stability.
3. Computing Skewness and Kurtosis
In most statistical software, skewness and kurtosis can be easily calculated. In Python, for example, you can use the scipy.stats library
# Import necessary libraries
import seaborn as sns
import matplotlib.pyplot as plt
from scipy.stats import skew, kurtosis
import pandas as pd

# Load the Iris dataset
url = 'https://raw.githubusercontent.com/selva86/datasets/master/Iris.csv'
iris = pd.read_csv(url)

iris.head()
| Id | SepalLengthCm | SepalWidthCm | PetalLengthCm | PetalWidthCm | Species | |
|---|---|---|---|---|---|---|
| 0 | 1 | 5.1 | 3.5 | 1.4 | 0.2 | Iris-setosa |
| 1 | 2 | 4.9 | 3.0 | 1.4 | 0.2 | Iris-setosa |
| 2 | 3 | 4.7 | 3.2 | 1.3 | 0.2 | Iris-setosa |
| 3 | 4 | 4.6 | 3.1 | 1.5 | 0.2 | Iris-setosa |
| 4 | 5 | 5.0 | 3.6 | 1.4 | 0.2 | Iris-setosa |
# Extract 'sepal_length' data
sepal_length = iris['SepalLengthCm']

# Compute skewness and kurtosis
print(f"Skewness of sepal_length: {skew(sepal_length):.2f}")
print(f"Kurtosis of sepal_length: {kurtosis(sepal_length, fisher=False):.2f}")
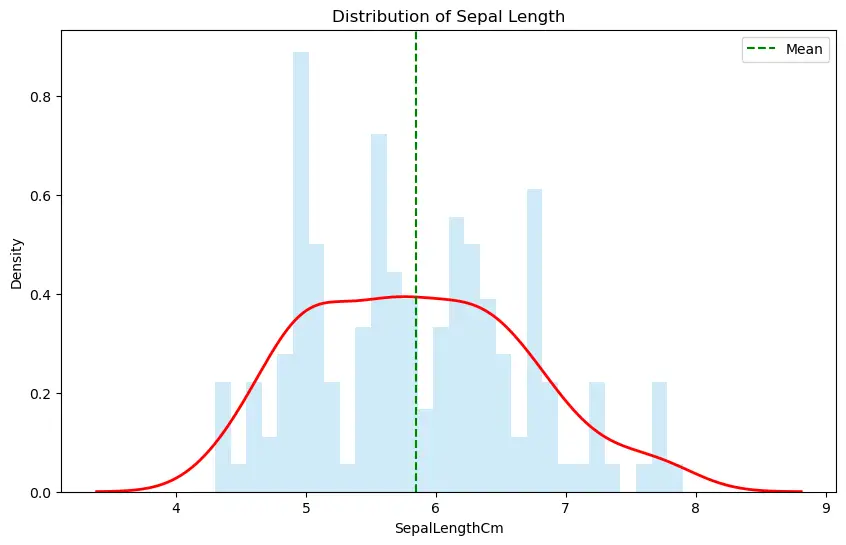
Skewness of sepal_length: 0.31
Kurtosis of sepal_length: 2.43
# Visualization using distplot
plt.figure(figsize=(10,6))
sns.distplot(sepal_length, bins=30, color='skyblue', kde_kws={'linewidth': 2, 'color': 'red'})
plt.axvline(x=sepal_length.mean(), color='green', linestyle='--', label='Mean')
plt.title('Distribution of Sepal Length')
plt.legend()
plt.show()

Lets look at another example
# Extract 'Sepal_Width' data
Sepal_Width = iris['SepalWidthCm']

# Compute skewness and kurtosis
print(f"Skewness of sepal_length: {skew(Sepal_Width):.2f}")
print(f"Kurtosis of sepal_length: {kurtosis(Sepal_Width, fisher=False):.2f}")
Skewness of sepal_length: 0.33
Kurtosis of sepal_length: 3.24
# Visualization using distplot
plt.figure(figsize=(10,6))
sns.distplot(Sepal_Width, bins=30, color='skyblue', kde_kws={'linewidth': 2, 'color': 'red'})
plt.axvline(x=Sepal_Width.mean(), color='green', linestyle='--', label='Mean')
plt.title('Distribution of Sepal Length')
plt.legend()
plt.show()

4. Importance of Understanding Skewness and Kurtosis
Skewness and kurtosis are crucial for various reasons:
- Normality Tests: Many statistical tests assume the data is normally distributed. Skewness and kurtosis can be indicators if this assumption holds true.
-
Risk Management: In finance, understanding the tails (extreme events) can be essential for risk assessment.
-
Data Preprocessing: Recognizing skewness might lead one to apply certain transformations, like logarithms, to make data more symmetric and meet modeling assumptions.
5. Conclusion
While skewness and kurtosis are just two of the many measures in statistics, they provide a deeper understanding of data distributions. By quantifying asymmetry and the propensity for extreme values, they serve as invaluable tools for researchers, analysts, and statisticians in various fields.


