Portfolio optimization in finance is the technique of creating a portfolio of assets, for which your investment has the maximum return and minimum risk.
 Investor’s Portfolio Optimization using Python with Practical Examples. Photo by Markus
In this tutorial you will learn:
- What is portfolio optimization?
- What does a portfolio mean?
- What are assets, returns and risk?
- Modern Portfolio Theory (MPT)
- What is the Efficient Frontier
- Fundamental terms in portfolio optimization
- Variance
- Volatility
- Covariance
- Correlation
- Expected Returns
- Building and optimal risky portfolio
- Covariance and correlation matrix
- Portfolio variance
- Portfolio expected returns
- Plotting the efficient frontier
- Sharpe Ratio
- Optimal Risky Portfolio
1. What is portfolio optimization?
Portfolio optimization is the process of creating a portfolio of assets, for which your investment has the maximum return and minimum risk.
Don’t worry if these terms made no sense to you, we will go over each one in detail.
2. What does a portfolio mean?
An investor’s portfolio basically is his/her investment in different kinds of assets from different companies.
For example, if you have investments in 3 companies, say, Google, Amazon and Tesla, then these 3 companies make up your investment portfolio.
But how do you invest in a company? You do so by purchasing assets of that company.
3. What are assets, returns and risk?
Assets are of various kinds. An asset is what you would purchase if you want to invest in a company.
These include, but are not limited to:
- Bonds
- Stocks
- Cash
- Real Estate
Usually when you build a portfolio, it is advisable to diversify your assets, or purchase different kinds of assets from different companies. For all assets, you will get a profit after a specified period of time. However, the profit may not be the same for each investment you make.
This profit is what we call returns.
For example, you will get returns from stocks when it’s market value goes up and similarly you will get returns from cash in form of interest.
But what if the company whose stocks you have purchased goes bankrupt?
This will lead to its stocks crashing in the share market and instead of gaining profits, you will also lose your capital investment.
This is what is called risk of investment.
Another aspect of risk is the fluctuations in the asset value. For certain assets, its value is highly volatile, that is, the value increases when the market goes up, and drops accordingly. Whereas certain other assets, like bonds and certain steady stocks, are relatively more resistant to market conditions, but may give lesser returns compared to high risk ones.
A good portfolio is one which gives us maximum return on our investment for minimum risk, as discussed earlier.
The next question is, how do we decide out of an infinite possible combinations for portfolios, the one which is optimum?
4. Modern Portfolio Theory (MPT)
Modern Portfolio Theory, or also known as mean-variance analysis is a mathematical process which allows the user to maximize returns for a given risk level.
It was formulated by H. Markowitz and while it is not the only optimization technique known, it is the most widely used.
MPT assumes that all investors are risk-averse, i.e, if there is a choice between low risk and high risk portfolios with the same returns, an investor will choose one with the low risk.
So, what is the MPT all about?
MPT encourages diversification of assets. It says that a high variance asset A if combined with diverse assets B and C, where A, B and C have little to no correlation, can give us a portfolio with low variance on returns.
This is the crux of the Modern Portfolio Theory.
5. What is Efficient Frontier?
We know every asset in a portfolio has its own rate expected returns and risks. It is possible to create multiple combinations of assets that can provide high returns for a pre-defined risk level.
Likewise, there can be multiple portfolios that give lowest risk for a pre-defined expected return.
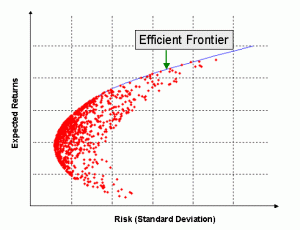
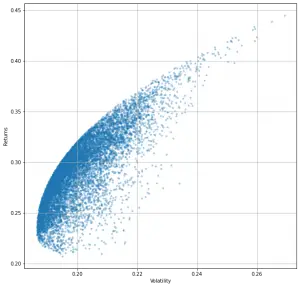
Efficient frontier is a graph with ‘returns’ on the Y-axis and ‘volatility’ on the X-axis. It shows the set of optimal portfolios that offer the highest expected return for a given risk level or the lowest risk for a given level of expected return.
Portfolios that lie outside the efficient frontier are sub-optimal because they do not provide either enough return for the level of risk or have a higher risk for the defined rate of return.
We will revisit this with an example again.
Now that you understand the term of portfolio optimization, let’s see how its actually implemented.
6. Fundamental terms in portfolio optimization
There are some statistical terms required in optimization process without which an optimal portfolio can’t be defined. Don’t worry, I will simplify it and make it easy and clear.
We will go through each one through an example.
In this example, we are considering a portfolio made up of stocks from just 2 companies, Tesla and Facebook.
Step 1: Pull the stock price data
The first step is to is to pull the required data from a verified site such as Yahoo or Quandl. The example below uses Yahoo and the dates for which we will be pulling the data is from 1st January, 2018 to 31st December, 2019.
# Load Packages
import numpy as np
import pandas as pd
from pandas_datareader import data
import matplotlib.pyplot as plt
%matplotlib inline
Let’s import the data.
# Read Data
test = data.DataReader(['TSLA', 'FB'], 'yahoo', start='2018/01/01', end='2019/12/31')
test.head()
As you can see, there are a lot of different columns for different prices throughout the day, but we will only focus on the ‘Adj Close’ column. This colum gives us the closing price of company’s stock on the given day.
# Closing price
test = test['Adj Close']
test.head()
| Symbols | TSLA | FB |
|---|---|---|
| Date | ||
| 2018-01-02 | 64.106003 | 181.419998 |
| 2018-01-03 | 63.450001 | 184.669998 |
| 2018-01-04 | 62.924000 | 184.330002 |
| 2018-01-05 | 63.316002 | 186.850006 |
| 2018-01-08 | 67.281998 | 188.279999 |
Step 2: Calculate percentage change in stock prices
Next, we calculate the percentage change in stock prices of tesla everyday. You will notice that that we take the log of percentage change.
But take log?
The reason for this is that log of the returns is time additive.
That is,
If r13 is the returns for time between t3 and t1.
r12 is the returns between t1 and t2 and
r23 is the returns between t2 and t3.
Then, log(r13) = log(r12) + log(r23)
For example:,
If p1 = 100, p2 = 110 and p3 = 120,
where p1 is price of stock in time 1
Then:
log(r12) = ln(p2/p1) = ln(110/100) = 9.53%,
log(r23) = ln(120/110) = 8.7% and
log(r13) = log(r12) + log(r23) = 9.53 + 8.7 = 18.23%, which is same as ln(120/100).
This means a log change of +0.1 today and then -0.1 tomorrow will give you the same value of stock as yesterday. This is not true if you simply compute percentage change.
It is common practice in portfolio optimization to take log of returns for calculations of covariance and correlation.
# Log of percentage change
tesla = test['TSLA'].pct_change().apply(lambda x: np.log(1+x))
tesla.head()
Date
2018-01-02         NaN
2018-01-03   -0.010286
2018-01-04   -0.008325
2018-01-05    0.006210
2018-01-08    0.060755
Name: TSLA, dtype: float64
Variance
The variance in prices of stocks of Tesla are an important indicator of how volatile this investment will be (how returns can fluctuate).
It can be calculated for each company by using built in .var() function. Under the hood, the formula implemented by this function is given by:
$$ s^2 = \sum_{i=1}^N (x_i – \bar{x})^2 / N-1 $$
# Variance
var_tesla = tesla.var()
var_tesla
0.0011483734269334596
Similarly for Facebook,
# Log of Percentage change for Facebook
fb = test['FB'].pct_change().apply(lambda x: np.log(1+x))
fb.head()
Date
2018-01-02         NaN
2018-01-03    0.017756
2018-01-04   -0.001843
2018-01-05    0.013579
2018-01-08    0.007624
Name: FB, dtype: float64
The variance is:
# Variance
var_fb = fb.var()
var_fb
#> .00045697258417022536
Volatility
Volatility is measured as the standard deviation of a company’s stock.
If you carefully look at the formula for standard deviation, you will understand that it is just the square root of variance.
$$ s = \sqrt{ \sum_{i=1}^N (x_i – \bar{x})^2 / N-1} $$
But volatility for the annual standard deviation. What we get from square root of variance is the daily standard deviation. To convert it to annual standard deviation we multiply the variance by 250.
250 is used because there are 250 trading days in a year.
# Volatility
tesla_vol = np.sqrt(var_tesla * 250)
fb_vol = np.sqrt(var_fb * 250)
tesla_vol, fb_vol
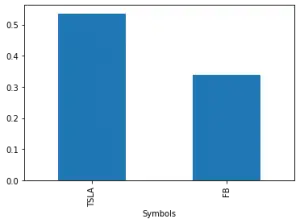
#> .5358109337568289  .33799873674698305
We can plot the volatility of both Tesla and Facebook for better visualization.
# Volatility of both stocks
test.pct_change().apply(lambda x: np.log(1+x)).std().apply(lambda x: x*np.sqrt(250)).plot(kind='bar')
Covariance
Covariance measures the directional relationship between the returns on two assets.
A positive covariance means that returns of the two assets move together while a negative covariance means they move inversely. Risk and volatility can be reduced in a portfolio by pairing assets that have a negative covariance.
We can calculate the covariance of Tesla and Facebook by using the .cov() function.
# Log of Percentage change
test1 = test.pct_change().apply(lambda x: np.log(1+x))
test1.head()| Symbols | TSLA | FB |
|---|---|---|
| Date | ||
| 2018-01-02 | NaN | NaN |
| 2018-01-03 | -0.010286 | 0.017756 |
| 2018-01-04 | -0.008325 | -0.001843 |
| 2018-01-05 | 0.006210 | 0.013579 |
| 2018-01-08 | 0.060755 | 0.007624 |
# Covariance
test1['TSLA'].cov(test1['FB'])
#> .00018261623156030972
You can notice that there is small positive covariance between Tesla and Facebook.
Correlation
Correlation, in the finance and investment industries, is a statistic that measures the degree to which two securities move in relation to each other. Correlations are used in advanced portfolio management, computed as the correlation coefficient, which has a value that must fall between -1.0 and +1.0.
You can think of correlation as a scaled version of covariance, where the values are restricted to lie between -1 and +1.
A correlation of -1 means negative relation, i.e, if correlation between Asset A and Asset B is -1, if Asset A increases, Asset B decreases.
A correlation of +1 means positive relation, i.e, if correlation between Asset A and Asset B is 1, if Asset A increases, Asset B increases.
A correlation of 0 means no relation, i.e, if correlation between Asset A and Asset B is 0, they dont have any effect on each other.
This is calculated using the .corr() function.
test1['TSLA'].corr(test1['FB'])
#> .2520883272466132
In line with the covariance, the correlation between Tesla and Facebook is also positive.
Expected Returns
Expected returns of an asset are simply the mean of percentage change in its stock prices. So, the value of expected return we obtain here are daily expected returns.
For an yearly expected return value, you will need to resample the data year-wise, as you will see further.
For expected returns, you need to define weights for the assets choosen.
In simpler terms, this means you need to decide what percentage of your total money to you want to hold in each company’s stock.
Usually this decision is done by using the optimization techniques we will discuss later but for now we will consider random weights for Tesla and Facebook.
First, let’s compute the log of percentage change.
test2 = test.pct_change().apply(lambda x: np.log(1+x))
test2.head()| Symbols | TSLA | FB |
|---|---|---|
| Date | ||
| 2018-01-02 | NaN | NaN |
| 2018-01-03 | -0.010286 | 0.017756 |
| 2018-01-04 | -0.008325 | -0.001843 |
| 2018-01-05 | 0.006210 | 0.013579 |
| 2018-01-08 | 0.060755 | 0.007624 |
Weights
Let’s define an array of random weights for the purpose of calculation. These weights will represent the percentage allocation of investments between these two stocks. They must add up to 1.
So, the problem of portfolio optimization is nothing but to find the optimal values of weights that maximizes expected returns while minimizing the risk (standard deviation).
# Define weights for allocation
w = [0.2, 0.8]
e_r_ind = test2.mean()
e_r_ind
Symbols
TSLA    0.000530
FB      0.000246
dtype: float64
The total expected return for a portfolio is given by:
$$ E(R_p) = w_1E(R_1) + w_2E(R_2) + ….. w_nE(R_n)$$
Thus, e_r, or total expected return can be calculated as:
# Total expected return
e_r = (e_r_ind*w).sum()
e_r
#> .0003027691524101118
7. Building an optimal risky portfolio
Now that you have gone through the building blocks of portfolio optimization, it is time to create an optimal portfolio using the same concepts.
We will be using stocks from 4 companies, namely, Apple, Nike, Google and Amazon for a period of 5 years.
You will learn to calculate the weights of assets for each one. Then, we will calculate the expected returns, minimum variance portfolio, optimal risky portfolio and efficient frontier. You will also learn a new term called Sharpe Ratio.
Let’s get started by pulling the required asset data from Yahoo.
# Import data
df = data.DataReader(['AAPL', 'NKE', 'GOOGL', 'AMZN'], 'yahoo', start='2015/01/01', end='2019/12/31')
df.head()
Just like earlier, we will only keep the ‘Adj Close’ column to perform our calculations.
# Closing price
df = df['Adj Close']
df.head()| Symbols | AAPL | NKE | GOOGL | AMZN |
|---|---|---|---|---|
| Date | ||||
| 2014-12-31 | 25.181044 | 44.454605 | 530.659973 | 310.350006 |
| 2015-01-02 | 24.941502 | 43.936787 | 529.549988 | 308.519989 |
| 2015-01-05 | 24.238857 | 43.229393 | 519.460022 | 302.190002 |
| 2015-01-06 | 24.241146 | 42.975098 | 506.640015 | 295.290009 |
| 2015-01-07 | 24.581060 | 43.862804 | 505.149994 | 298.420013 |
8. Covariance and Correlation matrix
The first step is to obtain a covariance and correlation matrix to understand how different assets behave with respect to each other. When we had a 2 asset portfolio, we directly plugged in the names of the assets into .cov() and .corr() functions.
In this case, we will need a matrix for better visualisation. This is also achieved by using the same 2 functions on our dataframe df.
Note that we perform necessary operations to display log change in prices of stocks each day.
# Log of percentage change
cov_matrix = df.pct_change().apply(lambda x: np.log(1+x)).cov()
cov_matrix| Symbols | AAPL | NKE | GOOGL | AMZN |
|---|---|---|---|---|
| Symbols | ||||
| AAPL | 0.000245 | 0.000084 | 0.000122 | 0.000142 |
| NKE | 0.000084 | 0.000219 | 0.000085 | 0.000092 |
| GOOGL | 0.000122 | 0.000085 | 0.000221 | 0.000176 |
| AMZN | 0.000142 | 0.000092 | 0.000176 | 0.000333 |
The covariance between Apple and Apple, or Nike and Nike is the variance of that asset.
The next step is to create the correlation matrix. Correlation ranges from -1 to 1.
- A correlation of -1 means negative relation, i.e, if correlation between Asset A and Asset B is -1, if Asset A increases, Asset B decreases.
- A correlation of +1 means positive relation, i.e, if correlation between Asset A and Asset B is 1, if Asset A increases, Asset B increases.
- A correlation of 0 means no relation, i.e, if correlation between Asset A and Asset B is 0, they dont have any effect on each other.
corr_matrix = df.pct_change().apply(lambda x: np.log(1+x)).corr()
corr_matrix| Symbols | AAPL | NKE | GOOGL | AMZN |
|---|---|---|---|---|
| Symbols | ||||
| AAPL | 1.000000 | 0.361145 | 0.524818 | 0.496704 |
| NKE | 0.361145 | 1.000000 | 0.387532 | 0.341431 |
| GOOGL | 0.524818 | 0.387532 | 1.000000 | 0.647952 |
| AMZN | 0.496704 | 0.341431 | 0.647952 | 1.000000 |
As you can see, an asset always has a perfectly positive correlation of 1 with itself.
9. Portfolio Variance
The formula for calculating portfolio variance differs from the usual formula of variance. It looks like this:
$$\sigma^2(Rp) = \sum{i=1}^{n} \sum_{j=1}^{n} w_i w_j COV(R_i, R_j) $$
Here, wi and wj denote weights of all assets from 1 to n (in our case from 1 to 4) and COV(Ri, Rj) is the covariance of the two assets denoted by i and j.
The simplest way to do this complex calculation is defining a list of weights and multiplying this list horizontally and vertically with our covariance matrix.
For this purpose, let’s define a random list of weights for all 4 assets. Remember that sum of weights should always be 1.
# Randomly weighted portfolio's variance
w = {'AAPL': 0.1, 'NKE': 0.2, 'GOOGL': 0.5, 'AMZN': 0.2}
port_var = cov_matrix.mul(w, axis=0).mul(w, axis=1).sum().sum()
port_var
0.00016069523003596587
Thus we have found the portfolio variance. But for truly optimizing the portfolio, we cant plug in random weights. We will need to calculate it according to what gives us maximum expected returns.
How will you find the portfolio expected return?
9. Portfolio expected returns
The mean of returns (given by change in prices of asset stock prices) give us the expected returns of that asset.
The sum of all individual expected returns further multiplied by the weight of assets give us expected return for the portfolio.
Note that we use the resample() function to get yearly returns. The argument to function, ‘Y’, denotes yearly.
If we dont perform resampling, we will get daily returns, like you saw earlier in the ‘Fundamental Terms’ section.
# Yearly returns for individual companies
ind_er = df.resample('Y').last().pct_change().mean()
ind_er
Output:
Symbols
AAPL     0.282997
NKE      0.195950
GOOGL    0.217545
AMZN     0.472289
dtype: float64
Portfolio returns
# Portfolio returns
w = [0.1, 0.2, 0.5, 0.2]
port_er = (w*ind_er).sum()
port_er
0.27071990038443955
Plotting the efficient frontier
This is the aim of going through all the topics above, to plot the efficient frontier. Efficient frontier is a graph with ‘returns’ on the Y-axis and ‘volatility’ on the X-axis. It shows us the maximum return we can get for a set level of volatility, or conversely, the volatility that we need to accept for certain level of returns.
The plot of efficient frontier looks something like this:
Below, you can see the calculations and code for finding the optimal weights of assets and plotting the efficient frontier for given portfolio.
But first, lets take a look at the volatiltilty and returns of individual assets for a better understanding.
# Volatility is given by the annual standard deviation. We multiply by 250 because there are 250 trading days/year.
ann_sd = df.pct_change().apply(lambda x: np.log(1+x)).std().apply(lambda x: x*np.sqrt(250))
ann_sd
Symbols
AAPL     0.247734
NKE      0.233798
GOOGL    0.235191
AMZN     0.288559
dtype: float64
assets = pd.concat([ind_er, ann_sd], axis=1) # Creating a table for visualising returns and volatility of assets
assets.columns = ['Returns', 'Volatility']
assets| Returns | Volatility | |
|---|---|---|
| Symbols | ||
| AAPL | 0.282997 | 0.247734 |
| NKE | 0.195950 | 0.233798 |
| GOOGL | 0.217545 | 0.235191 |
| AMZN | 0.472289 | 0.288559 |
Amazon has the maximum risk attached but it also offers the maximum returns. Apple lies somewhere in the middle, with average risk and return rates.
Next, to plot the graph of efficient frontier, we need run a loop. In each iteration, the loop considers different weights for assets and calculates the return and volatility of that particular portfolio combination.
We run this loop a 1000 times.
To get random numbers for weights, we use the np.random.random() function. But remember that the sum of weights must be 1, so we divide those weights by their cumulative sum.
Keep reading further to see how it’s done.
p_ret = [] # Define an empty array for portfolio returns
p_vol = [] # Define an empty array for portfolio volatility
p_weights = [] # Define an empty array for asset weights

num_assets = len(df.columns)
num_portfolios = 10000
for portfolio in range(num_portfolios):
    weights = np.random.random(num_assets)
    weights = weights/np.sum(weights)
    p_weights.append(weights)
    returns = np.dot(weights, ind_er) # Returns are the product of individual expected returns of asset and its
                                      # weights
    p_ret.append(returns)
    var = cov_matrix.mul(weights, axis=0).mul(weights, axis=1).sum().sum()# Portfolio Variance
    sd = np.sqrt(var) # Daily standard deviation
    ann_sd = sd*np.sqrt(250) # Annual standard deviation = volatility
    p_vol.append(ann_sd)
data = {'Returns':p_ret, 'Volatility':p_vol}

for counter, symbol in enumerate(df.columns.tolist()):
    #print(counter, symbol)
    data[symbol+' weight'] = [w[counter] for w in p_weights]
portfolios  = pd.DataFrame(data)
portfolios.head() # Dataframe of the 10000 portfolios created| Returns | Volatility | AAPL weight | NKE weight | GOOGL weight | AMZN weight | |
|---|---|---|---|---|---|---|
| 0 | 0.288656 | 0.195191 | 0.130962 | 0.309140 | 0.288193 | 0.271705 |
| 1 | 0.259440 | 0.191103 | 0.199891 | 0.269729 | 0.394412 | 0.135968 |
| 2 | 0.342442 | 0.209105 | 0.204257 | 0.231146 | 0.107200 | 0.457397 |
| 3 | 0.290496 | 0.194798 | 0.264460 | 0.229882 | 0.267749 | 0.237909 |
| 4 | 0.294159 | 0.196093 | 0.126596 | 0.453689 | 0.113033 | 0.306682 |
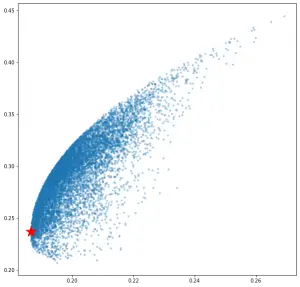
You can see that there are a number of portfolios with different weights, returns and volatility. Plotting the returns and volatility from this dataframe will give us the efficient frontier for our portfolio.
# Plot efficient frontier
portfolios.plot.scatter(x='Volatility', y='Returns', marker='o', s=10, alpha=0.3, grid=True, figsize=[10,10])
How to read the Efficient Frontier?
Each point on the line (left edge) represents an optimal portfolio of stocks that maximises the returns for any given level of risk.
The point (portfolios) in the interior are sub-optimal for a given risk level. For every interior point, there is another that offers higher returns for the same risk.
On this graph, you can also see the combination of weights that will give you all possible combinations:
- Minimum volatility (left most point)
- Maximum returns (top most point)
And everything in between.
min_vol_port = portfolios.iloc[portfolios['Volatility'].idxmin()]
# idxmin() gives us the minimum value in the column specified.
min_vol_port
Returns         0.236901
Volatility      0.186503
AAPL weight     0.252051
NKE weight      0.393245
GOOGL weight    0.310145
AMZN weight     0.044559
Name: 7553, dtype: float64
The minimum volatility is in a portfolio where the weights of Apple, Nike, Google and Amazon are 26%, 39%, 30% and 4% respectively. This point can be plotted on the efficient frontier graph as shown:
# plotting the minimum volatility portfolio
plt.subplots(figsize=[10,10])
plt.scatter(portfolios['Volatility'], portfolios['Returns'],marker='o', s=10, alpha=0.3)
plt.scatter(min_vol_port[1], min_vol_port[0], color='r', marker='*', s=500)
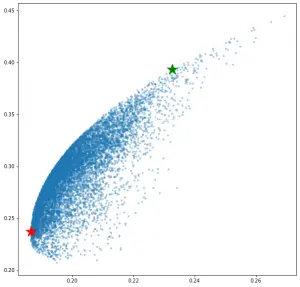
The red star denotes the most efficient portfolio with minimum volatility.
It is worthwhile to note that any point to the right of efficient frontier boundary is a sup-optimal portfolio.
We found the portfolio with minimum volatility, but you will notice that the return on this portfolio is pretty low. Any sensible investor wants to maximize his return, even if it is a tradeoff with some level of risk.
The question arises that how do we find this optimal risky portfolio and finally optimize our portfolio to the maximum?
This is done by using a parameter called the Sharpe Ratio.
Sharpe Ratio
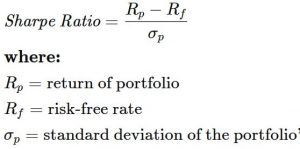
The ratio is the average return earned in excess of the risk-free rate per unit of volatility or total risk. Volatility is a measure of the price fluctuations of an asset or portfolio.
The risk-free rate of return is the return on an investment with zero risk, meaning it’s the return investors could expect for taking no risk.
The optimal risky portfolio is the one with the highest Sharpe ratio. The formula for this ratio is:
Below is the code for finding out portfolio with maximum Sharpe Ratio. This portfolio is the optimized portfolio that we wanted to find. We define the risk-free rate to be 1% or 0.01.
Optimal Risky Portfolio
An optimal risky portfolio can be considered as one that has highest Sharpe ratio.
Let’s find out.
# Finding the optimal portfolio
rf = 0.01 # risk factor
optimal_risky_port = portfolios.iloc[((portfolios['Returns']-rf)/portfolios['Volatility']).idxmax()]
optimal_risky_port
Returns         0.393435
Volatility      0.232716
AAPL weight     0.244612
NKE weight      0.110882
GOOGL weight    0.007497
AMZN weight     0.637009
Name: 4775, dtype: float64
You can notice that while the difference in risk between minimum volatility portfolio and optimal risky portfolio is just 6%, the difference in returns is a whopping 17%.
We can plot this point too on the graph of efficient frontier.
# Plotting optimal portfolio
plt.subplots(figsize=(10, 10))
plt.scatter(portfolios['Volatility'], portfolios['Returns'],marker='o', s=10, alpha=0.3)
plt.scatter(min_vol_port[1], min_vol_port[0], color='r', marker='*', s=500)
plt.scatter(optimal_risky_port[1], optimal_risky_port[0], color='g', marker='*', s=500)
The green star represents the optimal risky portfolio.
References
- Video series by Finquest
- Investopedia


