


In machine learning problems, feature selection helps in reducing overfitting, removes noisy variables, reduces memory footprint.
In this article we present a new technique, namely FRUFS.
The algorithm is based on the idea that the most important feature is the one that can largely represent all other features. Similarly, the second most important feature can approximate all other remaining features but not as well as the most important one and so on.
FRUFS is model agnostic and is unsupervised, which means that Y does not have a role to play in identifying the features importance. Hence in the first step we remove Y from the data. We then take a single feature j as the target and try to predict it with any model f using the remaining features.
In this technique, the target is X[j] and the features are X[~j], where X is the data.
All the features (except feature j) are used to predict feature j. The technique is model agnostic, meaning that any model right from linear regression to XGBoost can be used to predict the target feature j. In each iteration of identifying the target j using model m, the feature importance is calculated for all the remaining features. This process is repeated for all the features i.e 1<= j <= n and finally, feature importance is averaged. Note, sampling of data is applied to increase the speed of convergence of the algorithm
In summary, we can say that this algorithm depends on a feature’s ability to predict other features. If feature 1 can be predicted by feature 2, 3 and 4. We can easily drop features 2, 3 and 4. Based on this idea, FRUFS (Feature Relevance based Unsupervised Feature Selection) has been defined. The authors have described FRUFS as an unsupervised feature selection technique that uses supervised algorithms such as XGBoost to rank features based on their importance.
How To Use VevestaX
To track experiments — features, features engineered and parameters you can use VevestaX library. Install VevestaX as follows:
- pip install vevestaX
Import and create a vevesta object as follows
- from vevestaX import vevesta as v
-
V=v.Experiment()
To track feature used
- V.ds = data
where data is the pandas dataframe with the input features
To track features engineered
- V.fe = data
Finally, if you want to track specific variables used in the code, enclose with V.start() at the start of the code block and V.end() at the end of the code block. By default, VevestaX tracks all the variables used in the code. Finally, use V.dump to dump features and variables used into an excel file. Example

- V.dump(techniqueUsed = “XGBoost”)
If you are working on kaggle or colab or don’t want to use V.start() and V.end(), by default, VevestaX will track all the variables (of primitive data types) used in the code for you.
How to Use Frufs
You can install this library with
- pip install FRUFS
Start by importing the library
- from FRUFS import FRUFS
Call the FRUFS object as follows:
- model = FRUFS(model_r, model_c, k, n_jobs, verbose, categorical_features, random_state)
Example:
- model = FRUFS(model_r=DecisionTreeRegressor(random_state=27),k=5, n_jobs=-1, verbose=0, random_state=1)
Now Train the FRUFS model and use it to downsize your data
- x = model.fit_transform(x)
Finally, to get a plot of the feature importance scores
- model.feature_importance()
For more information on VevestaX, visit Github
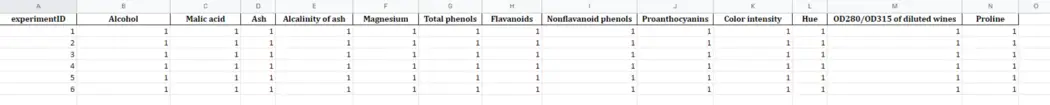
Sample output of the VevestaX library:
Data Sourcing tab details the features used in the experiment with 1 indicating feature present and 0 indicating its absence in the experiment.
Feature Engineering tab details the features created in the experiments such that 1 means feature was engineered in that experiment and 0 means it was not.

Modeling tab gives the details of features used in the experiment along with variables used in the code such as average Accuracy, shuffle Flag, etc.
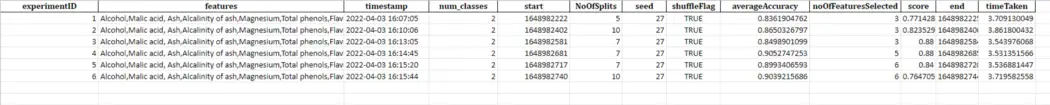
Messages tab gives the details of file used to do the experiment along with version, technique used in the experiment and timestamp of the experiment.

EDA-correlation as the name suggests gives the correlation between the features.

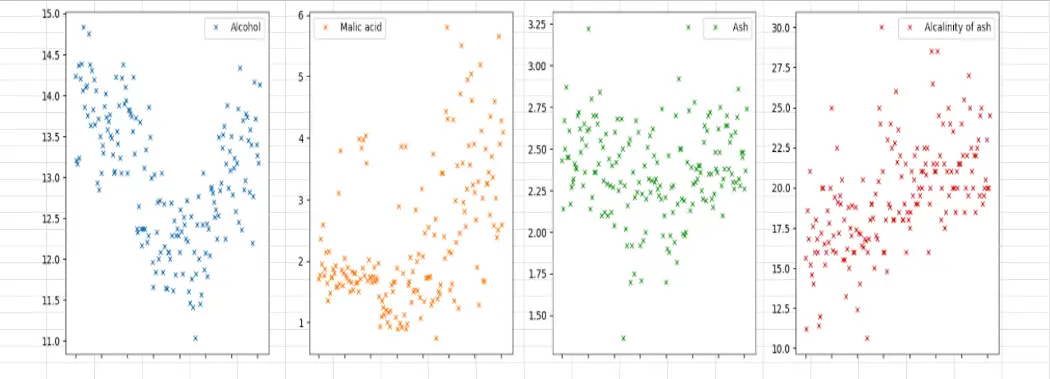
EDA-scatterplot as the name suggests gives the scatterplot of the features.
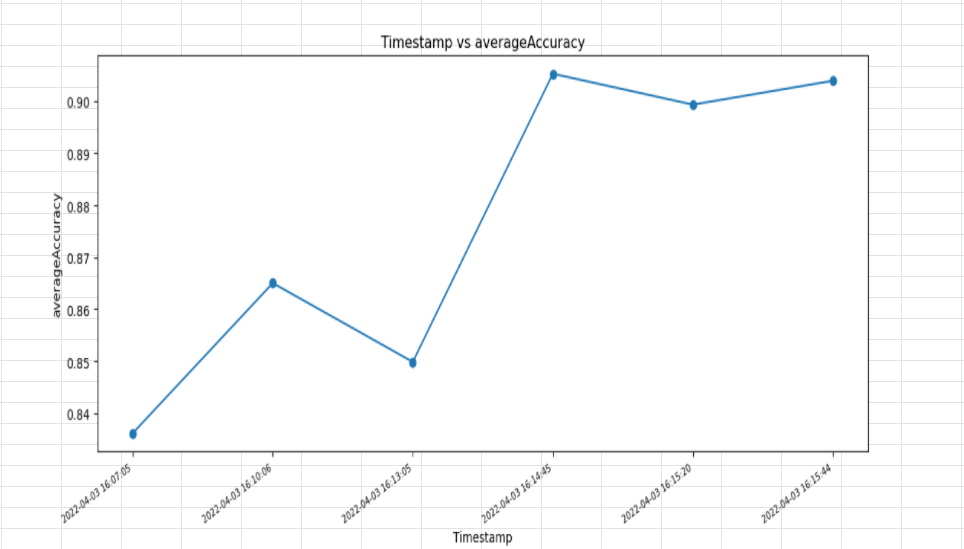
EDA-performance plot plots the values of variables used in the code with the experiment timestamps
Vevesta is the next generation GitHub for Machine Learning Project. Explore vevesta for free. For more such stories, follow us on twitter at @vevesta1

