Bias Variance Tradeoff is a design consideration when training the machine learning model. Certain algorithms inherently have a high bias and low variance and vice-versa. In this one, the concept of bias-variance tradeoff is clearly explained so you make an informed decision when training your ML models
 Bias Variance Tradeoff – Clearly Explained. Photo by Yang Shuo.
Contents
- Introduction
- What exactly is Bias?
- What is Variance Error?
- Example of High Bias and Low Variance
- Example of Low Bias and High Variance
- Bias – Variance TradeOff
- How to fix bias and variance problems?
Introduction
A machine learning model’s performance is evaluated based on how accurate is its prediction and how well it generalizes on another independent dataset it has not seen.
The errors in a machine learning model can be broken down into 2 parts:
1. Reducible Error
2. Irreducible Error
Irreducible errors are errors that cannot be reduced even if you use any other machine learning model.
Reducible errors, on the other hand, is further broken down into square of bias and variance. Due to this bias-variance, it causes the machine learning model to either overfit or underfit the given data. I will be discussing these in detail in this article.
What exactly is Bias?
Bias is the inability of a machine learning model to capture the true relationship between the data variables. It is caused by the erroneous assumptions that are inherent to the learning algorithm. For example, in linear regression, the relationship between the X and the Y variable is assumed to be linear, when in reality the relationship may not be perfectly linear.
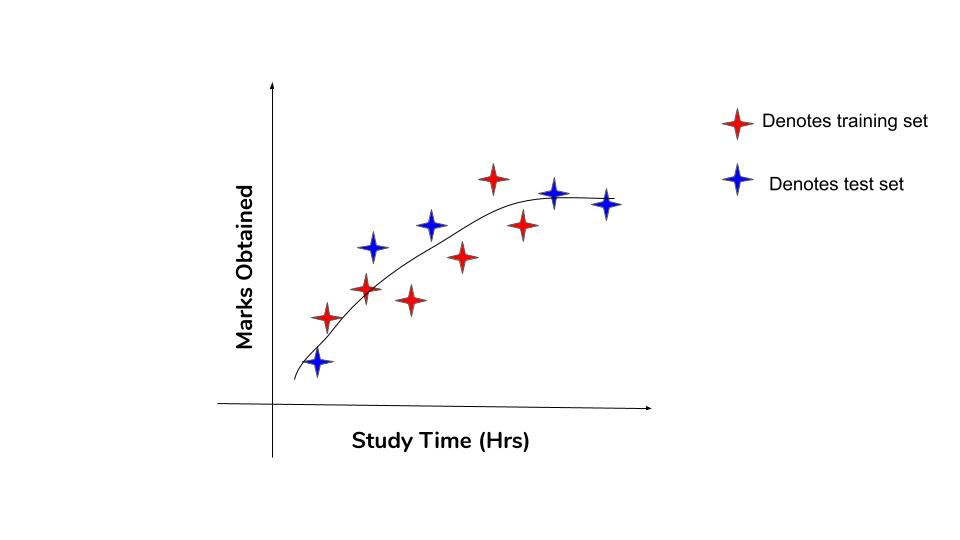
Let’s look at an example of artificial dataset with variables study hours and marks.
This graph shows the original relationship between the variables. Notice, there is a limit to the marks you can get on the test. That is even if you study an extraordinary amount of time, there is always a certain ‘maximum mark’ you can score. You can see the line flattening beyond a certain value of the X-axis. So the relationship is only piecewise linear. This sort of error will not be captured by the vanilla linear regression model.
You can expect an algorithm like linear regression to have high bias error, whereas an algorithm like decision tree has lower bias. Why? because decision trees don’t make such hard assumptions. So is the case with algorithms like k-Nearest Neighbours, Support Vector Machines, etc.
In general,
- High Bias indicates more assumptions in the learning algorithm about the relationships between the variables.
- Less Bias indicates fewer assumptions in the learning algorithm.
What is the Variance Error?
This is nothing but the concept of the model overfitting on a particular dataset. If the model learns to fit very closely to the points on a particular dataset, when it used to predict on another dataset it may not predict as accurately as it did in the first.
Variance is the difference in the fits between different datasets.
Generally, nonlinear machine learning algorithms like decision trees have a high variance. It is even higher if the branches are not pruned during training.
Low-variance ML algorithms: Linear Regression, Logistic Regression, Linear Discriminant Analysis.
High-variance ML algorithms: Decision Trees, k-NN, and Support Vector Machines.
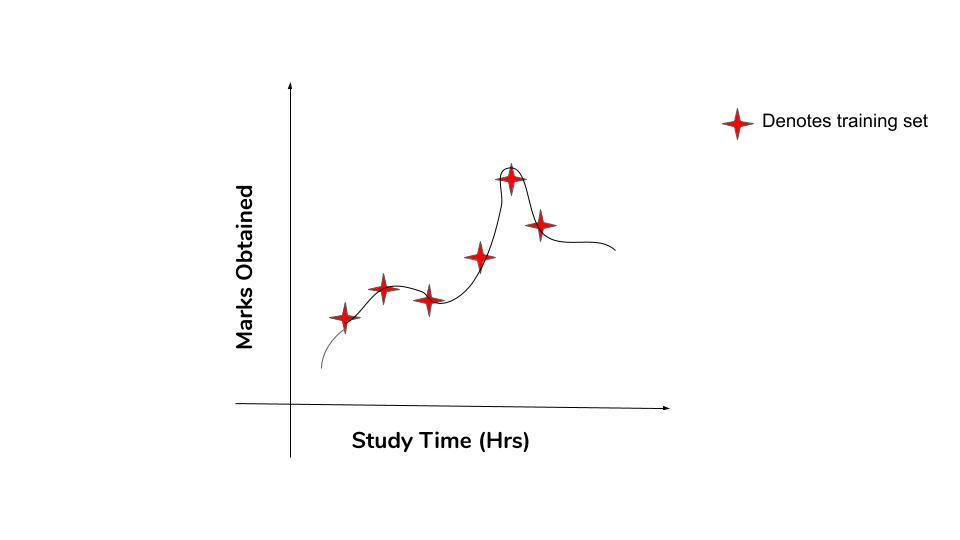
Let’s look at the same dataset and try to fit the training data better. Fitting the training data with more complex functions to reduce the error.
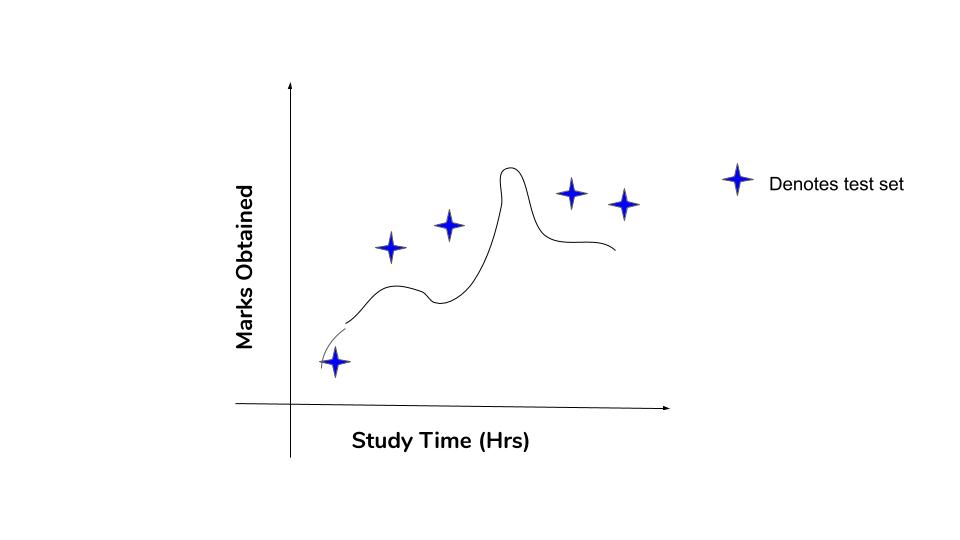
See that we have got nearly zero error in the training data. Now let’s try this curve to the test data.
The errors in the test data are more in this case. If there is more difference in the errors in different datasets, then it means that the model has a high variance. At the same time, this type of curvy model will have a low bias because it is able to capture the relationships in the training data unlike straight line.
Example of High Bias and Low Variance: Linear Regression Underfitting the Data
If a model has high bias, then it implies that the model is too simple and does not capture the relationship between the variables. This is called the underfitting of data. You can think of using a straight line to fit the data as in the case of linear regression as underfitting the data.
I am going to be using the dataset containing the height and weight of different People.
# importing the required modules
import numpy as np
import pandas as pd
df = pd.read_csv('weight-height.csv')
df = df[df['Gender']=='Female']
df = df[:100]
df.head()
| Gender | Height | Weight | |
|---|---|---|---|
| 5000 | Female | 58.910732 | 102.088326 |
| 5001 | Female | 65.230013 | 141.305823 |
| 5002 | Female | 63.369004 | 131.041403 |
| 5003 | Female | 64.479997 | 128.171511 |
| 5004 | Female | 61.793096 | 129.781407 |
Split the dataset as training and test sets.
# Train Test Split
df = df[:100]
x_train = df.iloc[:, 1:2].values
x_train = x_train[:70]

y_train = df.iloc[:, 2].values
y_train = y_train[:70]
Let’s try fitting the traning data using a straight line and then will check for the test dataset.
from sklearn.linear_model import LinearRegression
lin = LinearRegression()
lin.fit(x_train1, y_train1)
Let’s plot it.
import matplotlib.pyplot as plt
plt.scatter(x_train, y_train, color = 'blue')
plt.scatter(x_train, lin.predict(x_train), color = 'red')
plt.show()
Plot test data and actuals
# Predict and plot on test data
import matplotlib.pyplot as plt
x_test = x_train[70:100]
y_test = y_train[70:100]

plt.scatter(x_test, y_test, color = 'blue')
plt.scatter(x_test, lin.predict(x_test), color = 'red')
plt.show()
Evaluation Metric: Mean Squared Error
# Evaluate
from sklearn import metrics
rmse = np.sqrt(metrics.mean_squared_error(y_train1,lin.predict(x_train1)))
print(rmse)
rmse = np.sqrt(metrics.mean_squared_error(y_train2,lin.predict(x_train2)))
print(rmse)
10.764
10.035
See that the error for both the training set and the test set comes out to be same.
The model has high bias but low variance, as it was unable to fit the relationship between the variables, but works similar for even the independent datasets. Interesting enough the test data shows lower error in this case as the model has been generalized for independent datasets.
Example of Low Bias and High Variance: Overfitting the Data
High variance causes overfitting of the data, in this case the algorithm models random noises too which are present in the data.
In this case, I am going to use the same dataset, but with a different polynomial complex model, I will be following the same process as before.
import matplotlib.pyplot as plt
plt.scatter(x_train, y_train, color = 'blue')
plt.scatter(x_train, lin2.predict(poly.fit_transform(x_train)), color = 'red')
plt.show()
Predict on Test data
# Test Data prediction
import matplotlib.pyplot as plt
x_test = x_train[70:100]
y_test = y_train[70:100]

plt.scatter(x_test, y_test, color = 'blue')
plt.scatter(x_test, lin.predict(poly.fit_transform(x_test)), color = 'red')
plt.show()
Evaluate model with mean squared error
from sklearn import metrics
rmse = np.sqrt(metrics.mean_squared_error(y_train1,lin2.predict(poly.fit_transform(x_train1))))
print(rmse)
rmse = np.sqrt(metrics.mean_squared_error(y_train2,lin2.predict(poly.fit_transform(x_train2))))
print(rmse)
11.091
21.648
In this case, as you can see the model has fit the training data better, but not working even half as good for the test data. This model contains high variance but lower bias. Even though it fits the training data better, it was unable to predict the test data.
Bias – Variance Tradeoff
Let’s summarize:
- If a model uses a simple machine learning algorithm like in the case of a linear model in the above code, the model will have high bias and low variance(underfitting the data).
- If a model follows a complex machine learning model, then it will have high variance and low bias( overfitting the data).
- You need to find a good balance between the bias and variance of the model we have used. This tradeoff in complexity is what is referred to as bias and variance tradeoff. An optimal balance of bias and variance should never overfit or underfit the model.
- This tradeoff applies to all forms of supervised learning: classification, regression, and structured output learning.
How to fix bias and variance problems?
Fixing High Bias
- Adding more input features will help improve the data to fit better.
- Add more polynomial features to improve the complexity of the model.
- Decrease the regularization term to have a balance between bias and variance.
Fixing High Variance
- Reduce the input features, use only features with more feature importance to reduce overfitting the data.
- Getting more training data will help in this case, because the high variance model will not be working for an independent dataset if you have very data.


