Population stability Index (PSI) is a model monitoring metric that is used to quantify how much the distribution of a continuous response variable has changed between two given samples, typically collected at different points in time.
Originally, PSI was used to check if the distribution of the Y (aka the response variable or the scoring variable) within in the training dataset matches the distribution of the scoring variable in an out-of-sample dataset (the test data).
That is, it checks if the distribution of Y is different from the data on which the model was trained on.
We ideally want the distribution of Y on the scoring dataset to be similar to it’s distribution on the training dataset. Abnormal changes in the distribution is marked by a large value of PSI.
- PSI < 0.1: No major change, you can continue with the current model.
-
PSI < 0.2: Moderate population change, use your best judgement.
-
PSI >= 0.2: Significant population change, model retraining may be required.
Purpose of PSI
PSI is a model monitoring metric.
More popular use of PSI now is to keep a tab on the distribution of the model’s predictions during subsequent scoring runs.
Scoring runs means, the trained model being used to make predictions on batches of data over time.
When there is a significant rise in PSI, it might be a cause of concern which Data Scientists and concerned folks will have to pay attention to.
In addition to monitoring the scoring variable, you also want to calculate the PSI for features as well. Because if a feature with strong predictive power is prone to rapid changes, we might rethink about having those features in the model.
When you use PSI on an independent variable (a predictor), it is called as Characteristic Stability Index (CSI).
What can prompt a change in variable distribution (a high PSI)
There can be various reasons, such as:
- Changes in the business environment such as change of interest rates, macro economic factors like inflation, CPI Index, cost of raw materials including crude oil, iron, copper prices etc.
-
Change in Government Policy, restrictions on exports, imports of goods.
-
Error in data capturing equipment, process.
-
Data inconsistencies where the historic data itself has changed due to sourcing changes. Happens!
-
Changes in the model itself, algorithm changes, parameter changes etc that can cause the model to give poor results on certain segments of data.
How to calculate PSI?
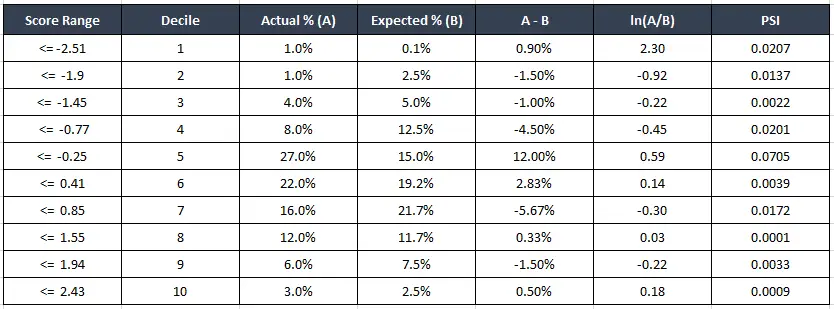
Population Stability Index Formula: Sum of (Actual% – Expected%) * Ln(Actual%/Expected%)
In the above equation,
‘Expected %’ corresponds to the first reference distribution at the time of scoring the model
‘Actual %’ points to the current data (that belongs to a more recent model scoring).
PSI Calculation Table:
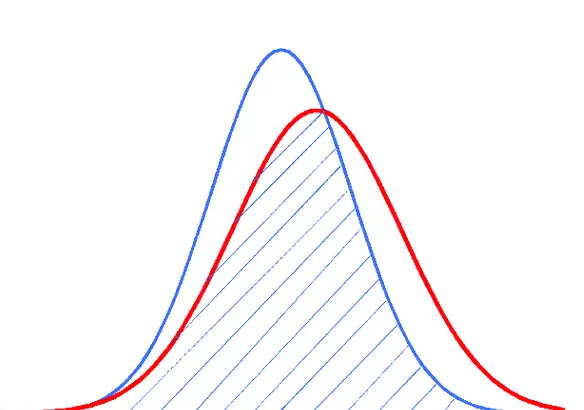
Usually when the PSI is large, the separation between distributions become more pronounced.
Suppose blue was expected, and the red was actual, on plotting the distributions of the variables, one with larger PSI will have a larger gap between actuals and expected.
[Density plot of overlapping distributions with changing PSI]
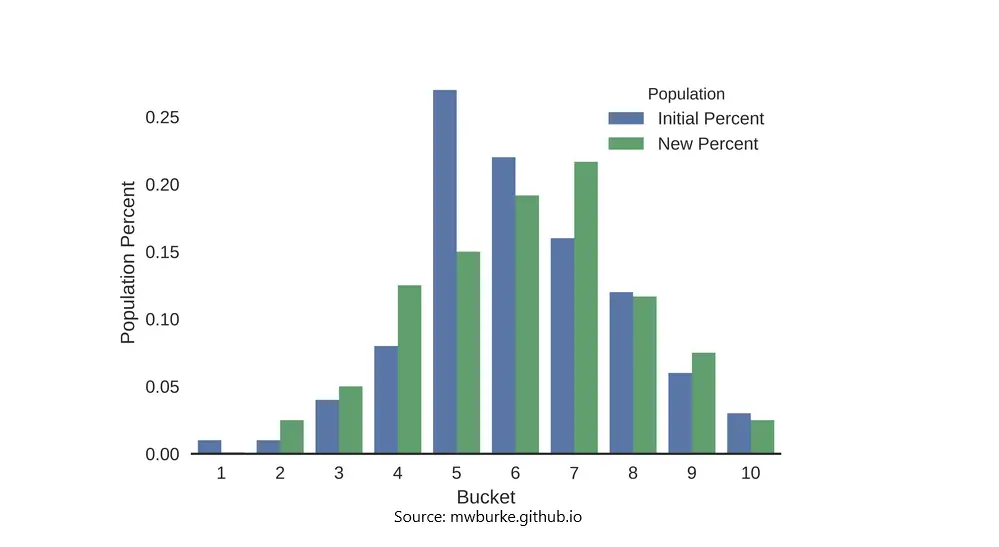
Alternately, you can make a histogram to shown the change in distributions for each bucket. This way, the difference between the actual and estimated becomes quite explicit, and you will know in which range of values the data drift is more pronounced.
[Histogram showing change in distributions for PSI]


