The pyplot object is the main workhorse of matplotlib library. It is through pyplot that you can create the figure canvas, various types of plots, modify and decorate them.
Contents
- Pyplot: Basic Overview
- General Functions in pyplot
- Line plot
- Scatter plot
- Pie chart
- Histogram
- 2D Histograms
- Bar plot
- Stacked Barplot
- Boxplot
- Stackplot
- Time series plotting
- Removing title overlaps in multiplots
- Irregular plot layout using GridSpec
1. Pyplot – Basic Overview
Matplotlib library in python has a dual interface:
- A MATLAB style interface which makes graphs and visualisations like MATLAB
- An Object Oriented Interface.
The MATLAB-style tools are contained in the pyplot interface which is often imported as plt.
The object oriented interface becomes useful when we get into complicated situations.
Like if you create 2 plots in the same figure, then you wont be able to alter changes to the first graph once you have created the second graph in MATLAB interface, but this is possible using object oriented inteface.
The pyplot provides the matlab like way of plotting functionality. That is, the plotting functions that you call with pyplot will be incrementally applied on the same currently active plot (subplot).
Now lets look into pyplot in detail.
First, import the required libraries
import numpy as np
import pandas as pd
import matplotlib.pyplot as plt
%matplotlib inline
plt.rcParams.update({'figure.figsize':(10,7.5), 'figure.dpi':100})

# if this shows error first you have to install the matplotlib library, using pip:
# !pip install matplotlib
The line %matplotlib inline will enable interactive plots embedded with the jupyter notebook and the likes.
plt.rcParams.update() changes the default parameters in matplotlib applying the properties to all the plots created in the notebook.
I will use an existing Datset – House Prediction Dataset.
You can download the dataset from this link
2. Pyplot functions you must know
The pyplot object is the main workhorse of matplotlib library. It is through pyplot that you can create a figure, create various types of plots, modify and decorate them. Even modifying the individual components of plots is achieved through pyplot only.
The commonly used functions in pyplot is below. By knowing the usage of these commands, you will be able to create pretty much any type of customization you want. A more detailed structured walkthrough of these pyplot commands is written in the matplotlib tutorial.
IMPORTANT PYPLOT COMMANDS YOU MUST KNOW
plt.figure()– Set the properties of the figure canvas, likefigsize,dpietc.plt.subplot()– Select the subplot to draw within the figure.plt.plot()– Makes a line plot by default. Can make other typesplt.subplots()– Create and initialize the figure and axes. This outputs the figure and axis objects.plt.scatter(x,y)– Draw a scatterplot of x and yplt.pie()– Create a pie chartplt.hist()– Create a histogramplt.hist2d()– Create 2-D Histogramplt.bar()– Create bar plotplt.text()– Add text annotation inside the plotplt.colorbar()– Add a colorbar. Used when color of dots in scatterplot is set based on a continuous numeric variable.plt.xlabel(), plt.ylabel()– label the x and y axisplt.xlim(), plt.ylim()– Set X and Y axis limitsplt.title()– Add current plot’s titleplt.legend()– Set the legend for current plotplt.suptitle()– Apply a title for entire figureplt.tight_layout()– Tightly arrange the subplotsplt.xticks(),plt.yticks()– Adjust the x and y axis ticks position and labelsplt.gca(),plt.gcf()– Get the current axis and figureplt.subplot2gridandplt.GridSpec– Lets you draw complex layoutsplt.show()– Display the entire plotplt.rcParams.update()– Update global plotting parameters
Now lets look into the common types of graphs we can plot using pyplot.
3. Line Plots
Use the ‘ plt.plot(x,y) ‘ function to plot the relation between x and y.
I created an Artificial Dataset using the np.linspace() command.
We need to specify the lower limit, upper limit and the no of points required.
# Simple lines plot
x = np.linspace(0,5,50) # 50 values between 0 and 5.
y1 = np.exp(x)
y2 = np.exp(x-1)
y3 = np.exp(x+1)

plt.plot(x,y1, '-',color='blue')
plt.plot(x,y2,'--',color='red')
plt.plot(x,y3, '-c',color='green');
plt.xlabel('X Axis')
plt.ylabel('Exponetial value')
plt.show()
# '--' generates line graph with dashed lines
4. Scatter Plots
1) Use plt.plot() function to draw simple scatter plots, you just need to specify 'o' inside the plt.plot() function. This will place dots in the chart. Specifying a * will place that character.
2) You can use plt.scatter() function also to plot the scatter plot.
The difference between using plt.plot() vs plt.scatter() to make a scatterplot is, plt.scatter() provides more flexibility to modify the color, shape and size of each dot. This is not possible with plt.plot()
# Scatterplot with plt.plot vs plt.scatter
# Data
x = np.linspace(0,5,20)
y1 = np.sin(x)
y2 = np.sin(x+1)

# Plot
plt.plot(x,y1,'o',color='blue', label='plt.plot')
plt.scatter(x, y2, c=y2, label='plt.scatter', cmap='Reds')

# Decorate
plt.title('Scatterplot with plt.plot vs plt.scatter')
plt.xlabel('x- VALUE')
plt.ylabel(' sine function ')
plt.legend(loc='upper right')
plt.colorbar()
plt.show()
Colormaps
In above chart, the points took a gradient of red colors because, I’d specified the cmap='Reds' inside plt.scatter().
Matplotlib comes with a large collection of such colormap palettes by default and you see all of them using dir(plt.cm).
print(dir(plt.cm))
['Accent', 'Accent_r', 'Blues', 'Blues_r', 'BrBG', 'BrBG_r', 'BuGn', 'BuGn_r', 'BuPu', 'BuPu_r', 'CMRmap', 'CMRmap_r', 'Dark2', 'Dark2_r', 'GnBu', 'GnBu_r', 'Greens', 'Greens_r', 'Greys', 'Greys_r', 'LUTSIZE', 'OrRd', 'OrRd_r', 'Oranges', 'Oranges_r', 'PRGn', 'PRGn_r', 'Paired', 'Paired_r', 'Pastel1', 'Pastel1_r', 'Pastel2', 'Pastel2_r', 'PiYG', 'PiYG_r', 'PuBu', 'PuBuGn', 'PuBuGn_r', 'PuBu_r', 'PuOr', 'PuOr_r', 'PuRd', 'PuRd_r', 'Purples', 'Purples_r', 'RdBu', 'RdBu_r', 'RdGy', 'RdGy_r', 'RdPu', 'RdPu_r', 'RdYlBu', 'RdYlBu_r', 'RdYlGn', 'RdYlGn_r', 'Reds', 'Reds_r', 'ScalarMappable', 'Set1', 'Set1_r', 'Set2', 'Set2_r', 'Set3', 'Set3_r', 'Spectral', 'Spectral_r', 'Wistia', 'Wistia_r', 'YlGn', 'YlGnBu', 'YlGnBu_r', 'YlGn_r', 'YlOrBr', 'YlOrBr_r', 'YlOrRd', 'YlOrRd_r', '__builtins__', '__cached__', '__doc__', '__file__', '__loader__', '__name__', '__package__', '__spec__', '_gen_cmap_d', '_reverser', 'afmhot', 'afmhot_r', 'autumn', 'autumn_r', 'binary', 'binary_r', 'bone', 'bone_r', 'brg', 'brg_r', 'bwr', 'bwr_r', 'cbook', 'cividis', 'cividis_r', 'cmap_d', 'cmaps_listed', 'colors', 'cool', 'cool_r', 'coolwarm', 'coolwarm_r', 'copper', 'copper_r', 'cubehelix', 'cubehelix_r', 'datad', 'flag', 'flag_r', 'functools', 'get_cmap', 'gist_earth', 'gist_earth_r', 'gist_gray', 'gist_gray_r', 'gist_heat', 'gist_heat_r', 'gist_ncar', 'gist_ncar_r', 'gist_rainbow', 'gist_rainbow_r', 'gist_stern', 'gist_stern_r', 'gist_yarg', 'gist_yarg_r', 'gnuplot', 'gnuplot2', 'gnuplot2_r', 'gnuplot_r', 'gray', 'gray_r', 'hot', 'hot_r', 'hsv', 'hsv_r', 'inferno', 'inferno_r', 'jet', 'jet_r', 'ma', 'magma', 'magma_r', 'mpl', 'nipy_spectral', 'nipy_spectral_r', 'np', 'ocean', 'ocean_r', 'pink', 'pink_r', 'plasma', 'plasma_r', 'prism', 'prism_r', 'rainbow', 'rainbow_r', 'register_cmap', 'revcmap', 'seismic', 'seismic_r', 'spring', 'spring_r', 'summer', 'summer_r', 'tab10', 'tab10_r', 'tab20', 'tab20_r', 'tab20b', 'tab20b_r', 'tab20c', 'tab20c_r', 'terrain', 'terrain_r', 'twilight', 'twilight_r', 'twilight_shifted', 'twilight_shifted_r', 'viridis', 'viridis_r', 'winter', 'winter_r']
5. Pie Chart
Pie chart shows the distribution of data based on the proportion of the pie occupied.
Use plt.pie() command to plot pie chart in python.
# Pie Chart (exploded)
explode = [0.1,0.1,0.15,0.1,0.15]

# explode function is used to show each pie separately
x = ['LabelA','LabelB','LabelC','LabelD','LabelE']
y = [200,250,1000,750,900]
plt.pie(y,
        labels= x,
        colors = ['red', 'orange','darkorange','blue','yellow'],
        explode=explode);
6. Histogram
plt.hist() command is used to draw histogram in matplotlib.
You need to specify the array and the no of bins as input to the function. See more histogram examples.
For this let’s use the house dataset from kaggle.
# Import Data
url = 'https://gitlab.com/selva86/datasets/-/blob/ed1f929b68beeaf2b1a4ddb38bbdf6271adfeebf/house.csv'
url = 'house.csv'
df  =  pd.read_csv(url)
df.head()
# Multiple Histograms
# Data
df1 = df[df['SaleCondition']=='Normal']
df2 = df[df['SaleCondition']=='Abnorml']
df3 = df[df['SaleCondition']=='Partial']

# Change the size of the plot
plt.rcParams.update({'figure.figsize':(7.5,5), 'figure.dpi':100})

# Plot the histogram for all 3 parts in the same graph
plt.hist(df1['SalePrice'], bins=50)
plt.hist(df2['SalePrice'], bins=50)
plt.hist(df3['SalePrice'], bins=50)
plt.xlabel('Price')
plt.ylabel('Distribution')
plt.show()
7. 2-D Histogram
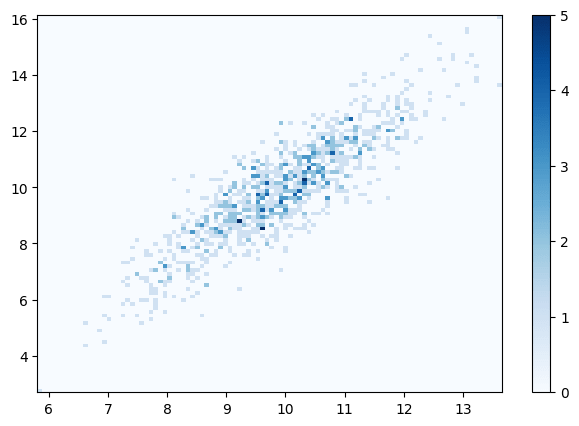
Use either the plt.hist2d or plt.hexbin function to draw the historgram.
First create a dataset using multivariate Gaussian Distribution.
# 2D Histogram
mean = [10, 10]
cov = [[1, 2], [2, 3]]
x, y = np.random.multivariate_normal(mean, cov, 1000).T
plt.hist2d(x, y, bins=100, cmap='Blues')
cb = plt.colorbar()
/Users/selvaprabhakaran/.pyenv/versions/3.6.8/envs/basepy/lib/python3.6/site-packages/ipykernel_launcher.py:4: RuntimeWarning: covariance is not positive-semidefinite.
  after removing the cwd from sys.path.
8. Bar Plot
Use plt.bar() function to plot bar graph in matplotlib.
You need to specify the index(X axis) and height(Y axis) as arguments for the bar plot. See more bar plot examples.
# Bar Chart
url = 'house.csv'
df  =  pd.read_csv(url)
sales = df[['SaleCondition', 'SalePrice']].groupby('SaleCondition').median()

# Plot
plt.bar(sales.index, height=sales.SalePrice, color='pink');
9. Stacked Bar Plot
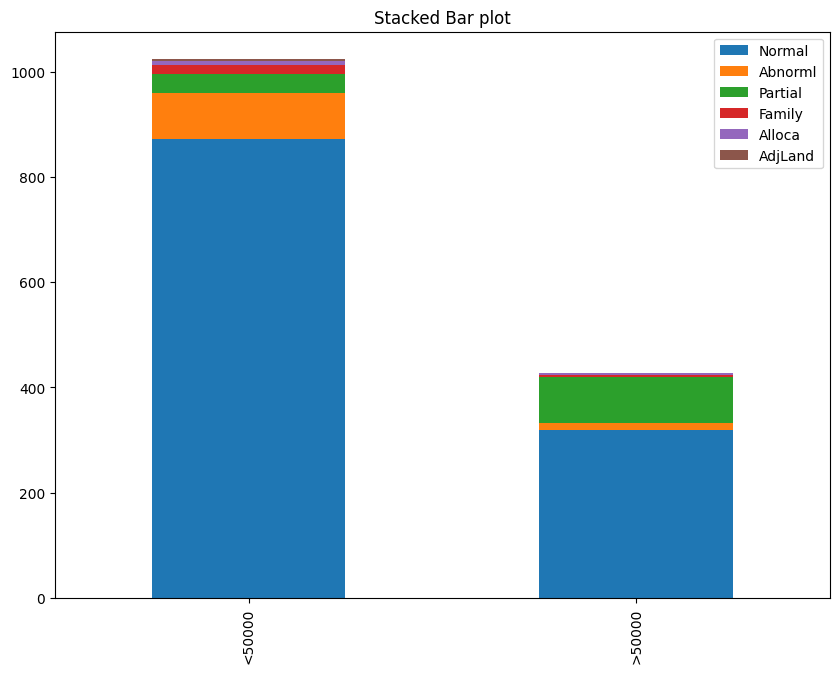
The stacked bar chart stacks bars that represent different groups on top of each other.
This can be done in pandas library by using stacked='True' command in df.plot() function.
# Stacked Bar Plot
# Data
url = 'house.csv'
df  =  pd.read_csv(url)
less     = df.loc[df['SalePrice']<200000, :]['SaleCondition'].value_counts()
greater  = df.loc[df['SalePrice']>200000, :]['SaleCondition'].value_counts()
df_plot  = pd.DataFrame([less, greater])
df_plot.index=['<50000','>50000']

# Plot
df_plot.plot(kind='bar',stacked=True, title='Stacked Bar plot');
10. Boxplot
Box plot helps in understanding the distribution more better.
You will be able to find the maximum value, minimum value and also the median value excluding the outliers in the data.
For plotting Boxplot, use plt.boxplot() function with x value as argument. See more boxplot examples.
# Box Plot
url = 'house.csv'
df  =  pd.read_csv(url)

# Plot
plt.boxplot(df['SalePrice'],patch_artist=True, notch=True);
The lower line represents the minimum value and the middle line represents the median value, the notch represents the 95% confidence interval and the top line represents the maximum value excluding the outliers.
11. Stackplot
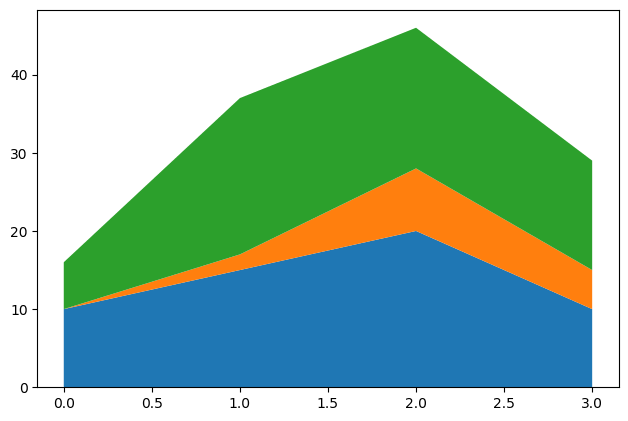
A stackplot is a line chart that is subdivided into its components so that the proportional contributions, as well as the totals, can be seen.
Use the stackplot() function with x and y as arguments to plot the graph.
x = [0, 1, 2, 3]
y1 = [10, 15, 20, 10]
y2 = [0, 2, 8, 5]
y3 = [6, 20, 18, 14]
y = np.vstack([y1, y2, y3])
fig, ax = plt.subplots()
ax.stackplot(x, y1, y2, y3)
plt.show()
12. Time Series Plotting
Use the same function plt.plot() which we used for line plot to plot the time series function.
Let’s use the candy production dataset.
df = pd.read_csv("candy_production.csv")
df.head()
| observation_date | IPG3113N | |
|---|---|---|
| 0 | 1972-01-01 | 85.6945 |
| 1 | 1972-02-01 | 71.8200 |
| 2 | 1972-03-01 | 66.0229 |
| 3 | 1972-04-01 | 64.5645 |
| 4 | 1972-05-01 | 65.0100 |
# Time Series Plot
# Plot
plt.plot(df['observation_date'], df['IPG3113N'])

# Decorate
xtick_labels = pd.to_datetime(df['observation_date'][::48]).dt.strftime('%Y-%m')
plt.xticks(df['observation_date'][::48], xtick_labels, rotation=30)
plt.title('Candy Production');
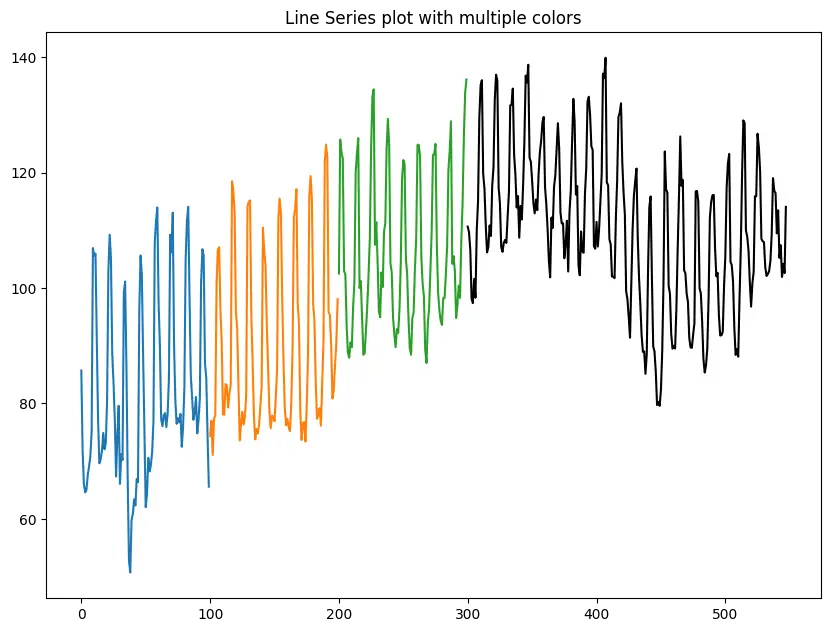
You can also divide the dataset into 2 parts and visualize it into different colours.
# Time Series Plot in multiple colors
plt.plot(df['IPG3113N'][:100])
plt.plot(df['IPG3113N'][100:200])
plt.plot(df['IPG3113N'][200:300])
plt.plot(df['IPG3113N'][300:], color='black')
plt.title('Line Series plot with multiple colors');
13. Removing title overlaps in multiplots
tight_layout attempts to resize subplots in a figure so that there are no overlaps between axes objects and labels on the axes.
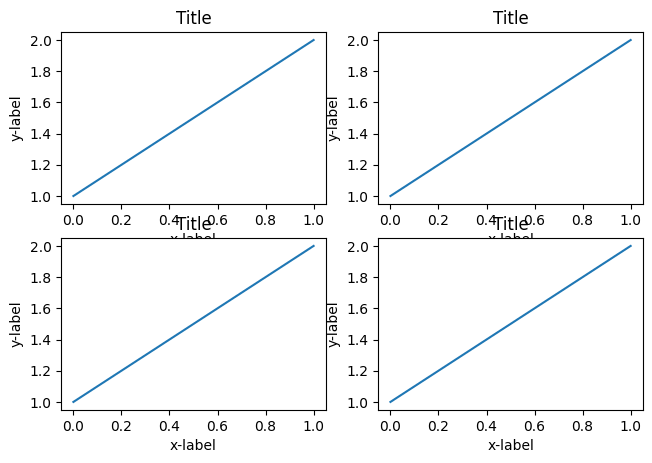
I will create 4 grids in the same plot initially without using the tight_layout function and then including the function to see the difference.
## Plots with overlapping titles
import matplotlib.pyplot as plt
plt.rcParams.update({'figure.figsize':(7.5,5), 'figure.dpi':100})

def plotnew(ax):
    ax.plot([1,2])
    ax.set_xlabel('x-label')
    ax.set_ylabel('y-label')
    ax.set_title('Title')

fig, ((ax1, ax2), (ax3, ax4)) = plt.subplots(nrows=2, ncols=2)
fig.suptitle('Plot with Ugly Overlapping titles')
plotnew(ax1)
plotnew(ax2)
plotnew(ax3)
plotnew(ax4)
You can see that in the above plot, there is overlap between the axis names and the titles of different plot.
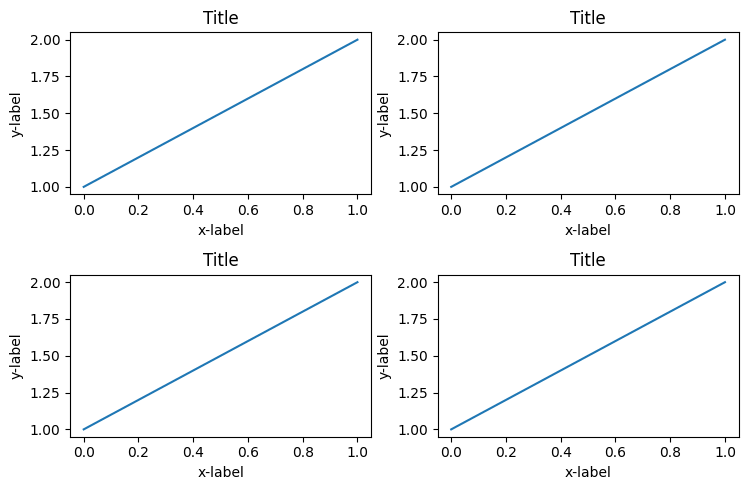
For fixing this, use tight_layout() function to automatically arrange them nicely.
# Non Overlapping Titles
import matplotlib.pyplot as plt
plt.rcParams.update({'figure.figsize':(7.5,5), 'figure.dpi':100})
def plotnew(ax):
    ax.plot([1,2])
    ax.set_xlabel('x-label')
    ax.set_ylabel('y-label')
    ax.set_title('Title')

# Plot
fig, ((ax1, ax2), (ax3, ax4)) = plt.subplots(nrows=2, ncols=2)
plotnew(ax1)
plotnew(ax2)
plotnew(ax3)
plotnew(ax4)
plt.tight_layout()
Now you can see that the grids are adjusted perfectly so that there are no overlaps.
But then, there is repeating and redundant information if the charts share the same title, axis values.
To make the plots share a common X and Y axis, specify sharex=True and sharey=True in plt.subplots() when you create the figure and axes.
To remove the space between the plots altogether use plt.subplots_adjust(wspace=0, hspace=0).
# Plots that the X and Y axes
import matplotlib.pyplot as plt
plt.rcParams.update({'figure.figsize':(7.5,5), 'figure.dpi':100})

def plotnew(ax):
    ax.plot([1,2])

# Plot
fig, ((ax1, ax2), (ax3, ax4)) = plt.subplots(nrows=2, ncols=2, sharex=True, sharey=True)
fig.suptitle('Main Title')
plotnew(ax1)
plotnew(ax2)
plotnew(ax3)
plotnew(ax4)
plt.subplots_adjust(wspace=0, hspace=0)
14. Irregular plot layout using GridSpec
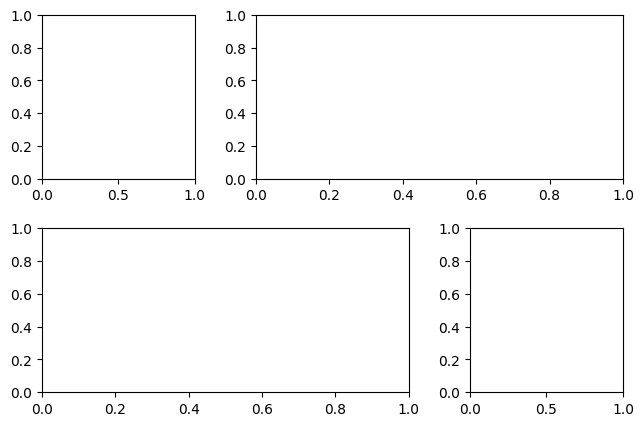
plt.GridSpec()is a great command if you want to create grids of different sizes in the same plot.
This can be used in a wide variety of cases for plotting multiple plots.
You need to specify the no of rows and no of columns as arguments to the fucntion along with the height and width space.
If you want to create a gridspec for a grid of two rows and two columns with some specified width and height space looks like this:
grid = plt.GridSpec(2, 3, wspace=0.4, hspace=0.3)
You will see that we can join 2 grids to form one big grid using the ,
operator inside the subplot() function.
plt.subplot(grid[0, 0])
plt.subplot(grid[0, 1:])
plt.subplot(grid[1, :2])
plt.subplot(grid[1, 2]);


