Quantiles and percentiles are crucial statistical concepts that assist in understanding and interpreting data. They are essentially tools to help divide datasets into smaller parts or intervals based on the data’s distribution.
Let’s delve deep into these concepts and see them in action with Python.

In this blog post we will learn
- Quantiles
- Percentiles
- Why are Quantiles and Percentiles Important?
- Real-life Applications
- Quantiles and Percentiles in Python
5.1. Calculating Quantiles
5.2. Calculating Percentiles
5.3. Visualize quartiles and percentiles using Python
5.4. Interquartile Range (IQR) - Conclusion
1. Quantiles
Quantiles are specific points in a data set that partition the data into intervals of equal probability. These points are used to understand the spread and distribution of the data.
The most common quantiles are:
- Quartiles: Divide the data into 4 equal parts
- Quintiles: Divide the data into 5 equal parts
- Deciles: Divide the data into 10 equal parts
Formula
To compute the $q$-th $k$-quantile (for example, quartiles where $k=4$), follow these steps:
- Arrange the data in ascending order.
- Compute the index:
$
\text{index} = \frac{q}{k} \times (n + 1)
$Where $n$ is the number of data points.
-
If the index is an integer, then the quantile is the data value at that index. If the index isn’t an integer, you may need to interpolate between two data points.
2. Percentiles
Percentiles divide a dataset into 100 equal parts. The $n$th percentile represents the value below which $n$ percent of the data falls. For instance, the 50th percentile (also known as the median) is the value below which 50% of the data lies.
Formula
To compute the $p$-th percentile (where $p$ is between 0 and 100):
- Arrange the data in ascending order.
- Compute the index:
$
\text{index} = \frac{p}{100} \times (n + 1)
$Where $n$ is the number of data points.
-
If the index is an integer, the percentile is the data value at that index. If the index isn’t an integer, interpolate between the two data points to get the percentile value.
3. Why are Quantiles and Percentiles Important?
-
Understanding Data Distribution: Quantiles and percentiles let us visualize the distribution of data. By identifying the median, quartiles, or other quantiles, we gain insight into the data’s spread and central tendency.
-
Comparison: We can draw insights by comparing percentiles from different datasets or different groups within a dataset. Standardized test scores, often reported in percentiles, allow individuals to see their performance relative to others.
-
Outlier Detection: We use the interquartile range (IQR) — the difference between the 3rd quartile (Q3) and the 1st quartile (Q1) — to detect outliers. We typically consider values that lie outside of 1.5 times the IQR below Q1 or above Q3 as outliers.
-
Data Summarization: We summarize data using the five-number summary, which includes the minimum, Q1, median, Q3, and maximum. This summary offers a quick way to grasp the distribution’s shape and spread.
-
Decision Making: In fields like medicine, doctors monitor children’s growth relative to a reference population using growth charts that employ percentiles.
-
Data Transformation: We use quantiles in data transformation techniques, such as quantile normalization, aiming to make two distributions statistically identical.
4. Real-life Applications
-
Finance: Identifying top/bottom 10% of stocks based on performance.
-
E-commerce: Recognizing the top 5% of customers based on purchase history.
-
Income Distribution: Economists use income percentiles to study inequality within an economy.
-
Clinical Trials: Researchers use percentiles to understand how a new drug’s effect compares to existing treatments.
5. Quantiles and Percentiles in Python
Example Data:
import numpy as np

data = np.array([10, 20, 30, 40, 50, 60, 70, 80, 90, 100])
5.1. Calculating Quantiles
quartiles = np.quantile(data, [0.25, 0.5, 0.75])
print(f"1st Quartile (Q1): {quartiles[0]}")
print(f"2nd Quartile (Q2)/Median: {quartiles[1]}")
print(f"3rd Quartile (Q3): {quartiles[2]}")
1st Quartile (Q1): 32.5
2nd Quartile (Q2)/Median: 55.0
3rd Quartile (Q3): 77.5
5.2. Calculating Percentiles
percentiles = np.percentile(data, [25, 50, 75])
print(f"25th Percentile: {percentiles[0]}")
print(f"50th Percentile/Median: {percentiles[1]}")
print(f"75th Percentile: {percentiles[2]}")
25th Percentile: 32.5
50th Percentile/Median: 55.0
75th Percentile: 77.5
Note: In the above example, the quartiles and percentiles will give the same result, as quartiles are specific percentiles (25th, 50th, and 75th).
5.3. Visualize quartiles and percentiles using Python
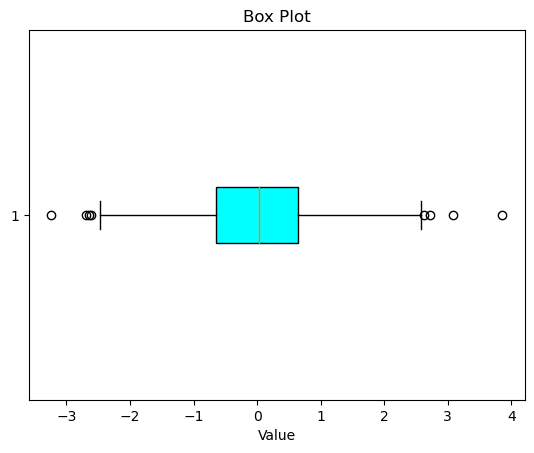
Let’s visualize quartiles and percentiles using Python, specifically with the help of the numpy and matplotlib libraries.
Here’s a simple demonstration:
- We will generate a set of random data.
- Calculate the quartiles and some percentiles.
- Visualize them on a box plot and a histogram.
import numpy as np
import matplotlib.pyplot as plt

# Set seed for reproducibility
np.random.seed(42)

# Generate 1000 random data points
data = np.random.randn(1000)

# Calculate quartiles
q1 = np.percentile(data, 25)
q2 = np.percentile(data, 50)  # Median
q3 = np.percentile(data, 75)

# Calculate some percentiles
p10 = np.percentile(data, 10)
p90 = np.percentile(data, 90)

# Plotting the data
plt.figure(figsize=(10, 6))

# Histogram
plt.hist(data, bins=50, alpha=0.6, color='g', label="Data Distribution")

# Quartiles and percentiles
plt.axvline(x=q1, color='r', linestyle='--', label="Q1 (25th percentile)")
plt.axvline(x=q2, color='b', linestyle='--', label="Q2 (Median/50th percentile)")
plt.axvline(x=q3, color='r', linestyle='--', label="Q3 (75th percentile)")
plt.axvline(x=p10, color='c', linestyle='-.', label="10th percentile")
plt.axvline(x=p90, color='m', linestyle='-.', label="90th percentile")

# Setting labels, title, and legend
plt.title("Visualization of Quartiles and Percentiles")
plt.xlabel("Value")
plt.ylabel("Frequency")
plt.legend()
plt.grid(True)
plt.show()

# Box plot
plt.boxplot(data, vert=False, patch_artist=True, boxprops=dict(facecolor='cyan'))
plt.title("Box Plot")
plt.xlabel("Value")
plt.show()

5.4. Interquartile Range (IQR)
The IQR represents the range between the 1st and 3rd quartile. It’s useful to identify outliers.
IQR = quartiles[2] - quartiles[0]
print(f"Interquartile Range: {IQR}")
Interquartile Range: 45.0
Outliers are typically considered values that are:
- Below Q1 – 1.5 x IQR
- Above Q3 + 1.5 x IQR/
6. Conclusion
Quantiles and percentiles offer valuable insights into the distribution and characteristics of datasets. They serve as pivotal instruments in diverse fields such as finance, e-commerce, and academic research. Equipped with Python and NumPy, extracting these metrics becomes a walk in the park, allowing you to make more informed decisions based on data analysis.


