K-Means Clustering is an unsupervised learning algorithm that aims to group the observations in a given dataset into clusters. The number of clusters is provided as an input. It forms the clusters by minimizing the sum of the distance of points from their respective cluster centroids.
Contents
- Basic Overview
- Introduction to K-Means Clustering
- Steps Involved
- Maths Behind K-Means Clustering
- Implementing K-Means from scratch
- Elbow Method to find the optimal number of clusters
- Grouping mall customers using K-Means
Basic Overview of Clustering
Clustering is a type of unsupervised learning which is used to split unlabeled data into different groups.
Now, what does unlabeled data mean?
Unlabeled data means we don’t have a dependent variable (response variable) for the algorithm to compare as the ground truth. Clustering is generally used in Data Analysis to get to know about the different groups that may exist in our dataset.
We try to split the dataset into different groups, such that the data points in the same group have similar characteristics than the data points in different groups.
Now how to find whether the points are similar?
Use a good distance metric to compute the distance between a point and every other point. The points that have less distance are more similar. Euclidean distance is the most common metric.
The formula for Euclidean distance is given by: ![]()
Clustering algorithms are generally used in network traffic classification, customer, and market segmentation. It can be used on any tabular dataset, where you want to know which rows are similar to each other and form meaningful groups out of the dataset. First I am going to install the libraries that I will be using.
# importing the required libraries
import pandas as pd
import numpy as np
import matplotlib.pyplot as plt
%matplotlib inline
Let’s look into one of the most common clustering algorithms: K-Means in detail. Hands-on implementation on real project: Learn how to implement classification algorithms using multiple techniques in my Microsoft Malware Detection Project Course.
Introduction to K-Means Clustering
K-Means follows an iterative process in which it tries to minimize the distance of the data points from the centroid points. It’s used to group the data points into k number of clusters based on their similarity.
Euclidean distance is used to calculate the similarity.
Let’s see a simple example of how K-Means clustering can be used to segregate the dataset. In this example, I am going to use the make_blobs the command to generate isotropic gaussian blobs which can be used for clustering.
I passed in the number of samples to be generated to be 100 and the number of centers to be 5.
from sklearn.datasets.samples_generator import make_blobs
X, y = make_blobs(n_samples=100, centers=5, random_state=101)
plt.rcParams.update({'figure.figsize':(10,7.5), 'figure.dpi':100})
plt.scatter(X[:, 0], X[:, 1]);
 As you can see from the above graph, there are 5 clusters that can be created from the dataset.
y
array([3, 1, 4, 3, 0, 0, 2, 4, 1, 1, 0, 1, 1, 0, 0, 0, 2, 0, 4, 0, 4, 3,
       4, 0, 0, 3, 1, 3, 4, 0, 1, 2, 4, 1, 1, 4, 3, 3, 1, 0, 2, 4, 0, 0,
       2, 4, 3, 1, 1, 1, 3, 3, 2, 4, 1, 3, 0, 2, 4, 4, 1, 3, 2, 2, 4, 0,
       3, 4, 1, 3, 4, 3, 2, 3, 2, 0, 2, 3, 1, 2, 1, 4, 2, 4, 3, 2, 2, 0,
       1, 2, 4, 0, 3, 2, 1, 4, 3, 2, 2, 0])
If you look at the value of y, you can see that the points are classified based on their clusters, but I won’t be using this compute the clusters, I will be using this only for evaluating purpose. For using K-Means you need to import KMeans from sklearn.cluster library.
from sklearn.cluster import KMeans
For using KMeans, you need to specify the no of clusters as arguments. In this case, as we can look from the graph that there are 5 clusters, I will be passing 5 as arguments. But in general cases, you should use the Elbow Method to find the optimal number of clusters. I will be discussing this method in detail in the upcoming sections.
Cluster = KMeans(n_clusters=5)
Cluster.fit(X)
y_pred = Cluster.predict(X)
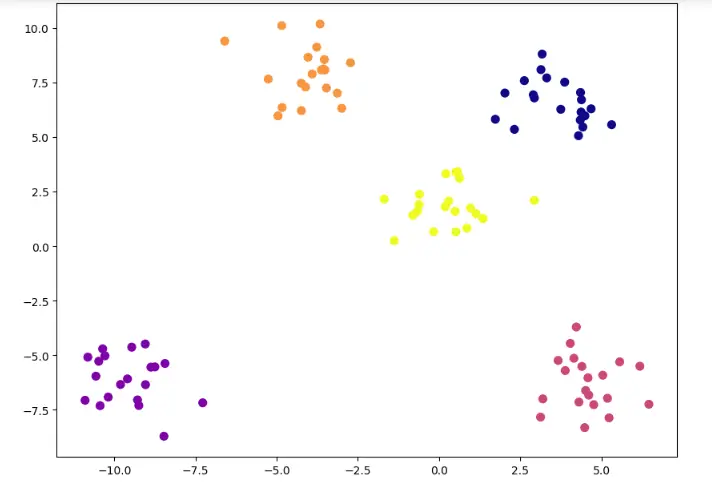
After passing the arguments, I have fitted the model and predicted the results. Now let’s visualize our predictions in a scatter plot.
plt.scatter(X[:, 0], X[:, 1], c=y_pred, s=50, cmap='plasma')
plt.rcParams.update({'figure.figsize':(10,7.5), 'figure.dpi':100})
 You can see that the predicted clusters are mostly the same as the clusters that you saw in the initial scatter plot. Now let’s look into how exactly the K-Means algorithm works.
Steps Involved
There are 3 important steps in K-Means Clustering.
- 1. Initialize centroids – This is done by randomly choosing K no of points, the points can be present in the dataset or also random points.
- 2. Assign Clusters – The clusters are assigned to each point in the dataset by calculating their distance from the centroid and assigning it to the centroid with minimum distance.
- 3. Re-calculate the centroids – Updating the centroid by calculating the centroid of each cluster we have created.
Let’s look into this by an example. 


Maths Behind K-Means Working
Our basic goal in any machine learning algorithm is to reduce the cost function. In the case of K-Means Clustering, the cost function is the sum of Euclidean distances from points to their nearby cluster centroids. The formula for Euclidean distance is given by ![]() The objective function for K-Means is given by :
The objective function for K-Means is given by :  Now we need to minimize J to reach the optimal value. So basically we are going to differentiate J with respect to 2 variables one after the other. In the first method, I will be treating ck as fixed and vary wik and the results are as follows:
  In this step, as you can see, the data point xi is assigned to the closest centroid ci with respect to Euclidean distance. In the second part, you will be getting the following result:
  This step is carried out to recompute the centroid of the cluster after the data points are assigned. The above two steps will be carried out iteratively until we get the optimal segregation of data points.
One of the few things that you need to keep in mind is that as we are using euclidean distance as the main parameter, it will be better to standardize your dataset if the x and y vary way too much like 10 and 100.
Also, it’s recommended to choose a wide range of points as initial clusters to check whether we are getting the same output, there is a possibility that you may get stuck at the local minimum rather than the global minimum.
Implementing K-Means from scratch
Let’s use the same make_blobs example we used at the beginning. We will try to do the clustering without using the KMeans library.
import pandas as pd
import numpy as np
import matplotlib.pyplot as plt
import seaborn as sns
# using the make_blobs dataset
from sklearn.datasets.samples_generator import make_blobs
X, y = make_blobs(n_samples=100, centers=5, random_state=101)
# setting the number of training examples
m=X.shape[0]
n=X.shape[1]
n_iter=50
I have set the K value to be 5 as before and also initialized the centroids randomly at first using the random.randint() function.
# computing the initial centroids randomly
K=5
import random

# creating an empty centroid array
centroids=np.array([]).reshape(n,0)

# creating 5 random centroids
for k in range(K):
    centroids=np.c_[centroids,X[random.randint(0,m-1)]]
Then I am going to find the distance between the points. Euclidean distance is most commonly used for finding the similarity.
output={}

# creating an empty array
euclid=np.array([]).reshape(m,0)

# finding distance between for each centroid
for k in range(K):
       dist=np.sum((X-centroids[:,k])**2,axis=1)
       euclid=np.c_[euclid,dist]

# storing the minimum value we have computed
minimum=np.argmin(euclid,axis=1)+1
I have also stored all the minimum values in a variable minimum. Then I regrouped the dataset based on the minimum values we got and calculated the centroid value.
# computing the mean of separated clusters
cent={}
for k in range(K):
    cent[k+1]=np.array([]).reshape(2,0)

# assigning of clusters to points
for k in range(m):
    cent[minimum[k]]=np.c_[cent[minimum[k]],X[k]]
for k in range(K):
    cent[k+1]=cent[k+1].T

# computing mean and updating it
for k in range(K):
     centroids[:,k]=np.mean(cent[k+1],axis=0)
Then we need to repeat the above 2 steps over and over again until we reach the convergence.
# repeating the above steps again and again
for i in range(n_iter):
      euclid=np.array([]).reshape(m,0)
      for k in range(K):
          dist=np.sum((X-centroids[:,k])**2,axis=1)
          euclid=np.c_[euclid,dist]
      C=np.argmin(euclid,axis=1)+1
      cent={}
      for k in range(K):
           cent[k+1]=np.array([]).reshape(2,0)
      for k in range(m):
           cent[C[k]]=np.c_[cent[C[k]],X[k]]
      for k in range(K):
           cent[k+1]=cent[k+1].T
      for k in range(K):
           centroids[:,k]=np.mean(cent[k+1],axis=0)
      final=cent
Let’s plot it.
plt.scatter(X[:,0],X[:,1])
plt.rcParams.update({'figure.figsize':(10,7.5), 'figure.dpi':100})
plt.title('Original Dataset')
 This is the original dataset and you can visually see that there are 5 clusters in the dataset., now let’s look into the classified Dataset.
for k in range(K):
    plt.scatter(final[k+1][:,0],final[k+1][:,1])
plt.scatter(centroids[0,:],centroids[1,:],s=300,c='yellow')
plt.rcParams.update({'figure.figsize':(10,7.5), 'figure.dpi':100})
plt.show()
 As you can see, we have got the result exactly the same as what we got with using the KMeans command.
Elbow method to find the optimal number of clusters
One of the important steps in K-Means Clustering is to determine the optimal no. of clusters we need to give as an input. This can be done by iterating it through a number of n values and then finding the optimal n value.
For finding this optimal n, the Elbow Method is used.
You have to plot the loss values vs the n value and find the point where the graph is flattening, this point is considered as the optimal n value.
from sklearn.datasets.samples_generator import make_blobs
X, y = make_blobs(n_samples=100, centers=5, random_state=101)
Let’s look at the example we have seen at first, to see the working of the elbow method. I am going to iterate it through a series of n values ranging from 1-20 and then plot their loss values.
import seaborn as sns
from sklearn.cluster import KMeans
elbow=[]
for i in range(1, 20):
    kmeans = KMeans(n_clusters = i, init = 'k-means++', random_state = 101)
    kmeans.fit(X)
    elbow.append(kmeans.inertia_)
sns.lineplot(range(1, 20), elbow,color='blue')
plt.rcParams.update({'figure.figsize':(10,7.5), 'figure.dpi':100})
plt.title('ELBOW METHOD')
plt.show()
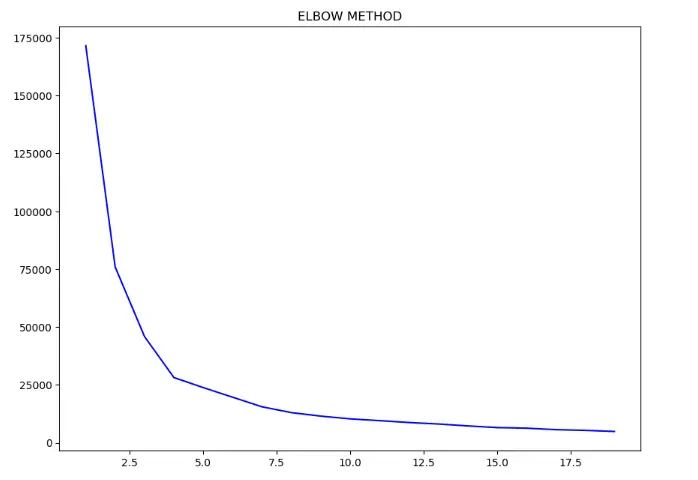
 You can see that the graph starts to flatten after reaching 5, which means that even if we increase the no of clusters after that point, there is no significant change in the loss value. So we can take the optimal value to be 5 which we also confirmed by visualizing the scatter plot.
Grouping mall customers using K-Means
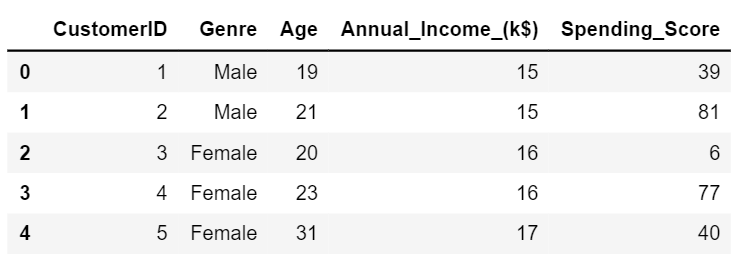
I am going to be using the Mall_Customers Dataset. You can download the dataset from the given link
df=pd.read_csv("Mall_Customers.csv")
df.head()
Let’s try to find if there are certain clusters between the customers based on their Age and Spending Score.
X = df.iloc[:, [2, 4]].values
from sklearn.cluster import KMeans
elbow=[]
for i in range(1, 20):
    kmeans = KMeans(n_clusters = i, init = 'k-means++', random_state = 101)
    kmeans.fit(X)
    elbow.append(kmeans.inertia_)
import seaborn as sns
sns.lineplot(range(1, 20), elbow,color='blue')
plt.rcParams.update({'figure.figsize':(10,7.5), 'figure.dpi':100})
plt.title('ELBOW METHOD')
plt.show()
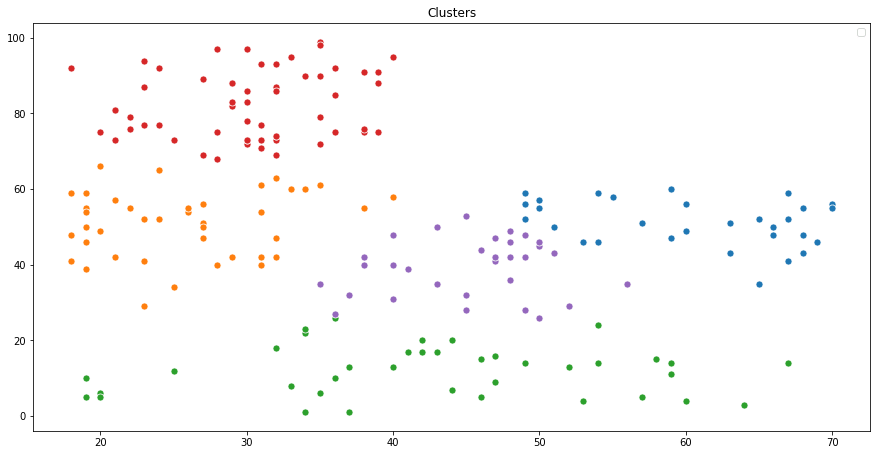
 As you can see from the above-elbow plot that the graph starts to flatten after reaching 5 number of clusters. So let’s use 5 as the number of clusters.
kmeans = KMeans(n_clusters = 5, init = 'k-means++', random_state = 101)
y_pred = kmeans.fit_predict(X)
plt.figure(figsize=(15,7.5))
sns.scatterplot(X[y_pred == 0, 0], X[y_pred == 0, 1],s=50)
sns.scatterplot(X[y_pred == 1, 0], X[y_pred == 1, 1],s=50)
sns.scatterplot(X[y_pred == 2, 0], X[y_pred == 2, 1],s=50)
sns.scatterplot(X[y_pred == 3, 0], X[y_pred == 3, 1],s=50)
sns.scatterplot(X[y_pred == 4, 0], X[y_pred == 4, 1],s=50)
plt.title('Clusters')
plt.legend()
plt.show()
 You can see that they are grouped into 5 clusters. If you also need to visualize the cluster centers in the graph, then use the
 kmeans.cluste_centers_ command.
plt.figure(figsize=(15,7.5))
sns.scatterplot(X[y_pred == 0, 0], X[y_pred == 0, 1],s=50)
sns.scatterplot(X[y_pred == 1, 0], X[y_pred == 1, 1],s=50)
sns.scatterplot(X[y_pred == 2, 0], X[y_pred == 2, 1],s=50)
sns.scatterplot(X[y_pred == 3, 0], X[y_pred == 3, 1],s=50)
sns.scatterplot(X[y_pred == 4, 0], X[y_pred == 4, 1],s=50)
sns.scatterplot(kmeans.cluster_centers_[:, 0], kmeans.cluster_centers_[:, 1],s=500,color='yellow')
plt.title('Clusters')
plt.legend()
plt.show()
 You can also try doing this using the `Annual_Income` and the `Spending_Score` for practice. Hands-on implementation on real project: Learn how to implement classification algorithms using multiple techniques in my Microsoft Malware Detection Project Course.


