Correlation is a fundamental concept in statistics and data science. It quantifies the degree to which two variables are related. But what does this mean, and how can we use it to our advantage in real-world scenarios? Let’s dive deep into understanding correlation, how to measure it, and its practical implications.

In this Blog post we will learn:
- What is Correlation?
- Importance of Correlation in Data Science?
- How to Measure Correlation?
3.1. Typs of Correlation
3.2. Pearson Correlation Coefficient
3.3. Formula:
3.4. Explanation:
3.5. Interpretation: - Calculate Correlation Using Python
4.1. Visualize Correlations
4.2. Test for Significance in Correlation
4.3. Handle Multiple Correlations
4.4. Visualizing the Correlation Matrix with a Heatmap
4.5. How to Account for Non-Linear Correlations? - Difference Between Correlation and Causation?
- Conclusion
1. What is Correlation?
Correlation refers to a statistical measure that represents the strength and direction of a linear relationship between two variables. If you’ve ever wondered if one event or variable has a relationship with another, you’re thinking about correlation. For instance, does the number of hours you study correlate with your exam scores?
2. Importance of Correlation in Data Science?
Understanding correlations can help data scientists:
- Discover relationships between variables.
- Determine important variables for predictive modeling.
- Uncover underlying patterns in data.
- Make better business decisions by understanding key drivers.
3. How to Measure Correlation?
The most common measure of correlation is the Pearson correlation coefficient, often denoted as ‘r’. Its values range between -1 and 1. Here’s what these values indicate:
- 1 or -1: Perfect correlation; 1 is positive, -1 is negative.
- 0: No correlation.
- Between 0 and ±1: Varying degrees of correlation, with strength increasing as it approaches ±1.
3.1. Typs of Correlation
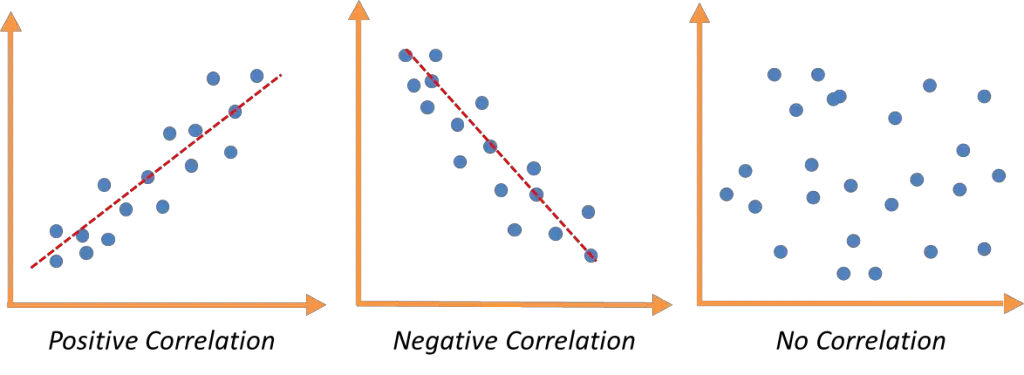
Positive Correlation:
– Value: $r$ is between 0 and +1.
– Meaning: When one variable increases, the other also increases, and when one decreases, the other also decreases.
– Graphically, a positive correlation will generally display a line of best fit that slopes upwards.
Negative Correlation:
– Value: $r$ is between 0 and -1.
– Meaning: When one variable increases, the other decreases, and vice versa.
– Graphically, a negative correlation will typically show a line of best fit that slopes downwards.
No Correlation (Zero Correlation):
– Value: $r$ is approximately 0.
– Meaning: Changes in one variable do not predict any particular change in the other variable. They move independently of each other.
– Graphically, data with no correlation will appear scattered with no discernible pattern or trend.

3.2. Pearson Correlation Coefficient
The Pearson correlation coefficient, often denoted as $r$, quantifies the linear relationship between two variables. Let’s delve into its formula and understand its significance.
3.3. Formula:
Given two variables, $X$ and $Y$, with data points $x_1, x_2, …, x_n$ and $y_1, y_2, …, y_n$ respectively, the Pearson correlation coefficient, $r$, is formulated as:
$
r = \frac{\sum_{i=1}^{n} (x_i – \bar{x})(y_i – \bar{y})}{\sqrt{\sum_{i=1}^{n} (x_i – \bar{x})^2 \sum_{i=1}^{n} (y_i – \bar{y})^2}}
$
Where:
– $\bar{x}$ represents the mean of the $x$ values.
– $\bar{y}$ represents the mean of the $y$ values.
3.4. Explanation:
- Numerator:
- The numerator, $\sum_{i=1}^{n} (x_i – \bar{x})(y_i – \bar{y})$, sums up the product of the deviations of each data point from their respective averages. This evaluates if the deviations of one variable coincide with the deviations of the other.
- Denominator:
- The denominator ensures normalization of the coefficient, ensuring that $r$ remains between -1 and 1. The terms $\sum_{i=1}^{n} (x_i – \bar{x})^2$ and $\sum_{i=1}^{n} (y_i – \bar{y})^2$ sum the squared deviations of each data point from their means for $X$ and $Y$ respectively.
- Outcome:
- $r = 1$: Indicates a perfect positive linear relationship between $X$ and $Y$.
- $r = -1$: Signifies a perfect negative linear relationship between $X$ and $Y$.
- $r = 0$: Suggests no evident linear trend between the variables.
3.5. Interpretation:
Envision plotting the data points of $X$ and $Y$ on a scatter plot. The Pearson correlation provides insight into how closely these points cluster around a straight line.
- An $r$ value near 1 implies that as $X$ elevates, $Y$ also tends to rise, resulting in an upward trending line.
- An $r$ value nearing -1 indicates that as $X$ escalates, $Y$ generally diminishes, yielding a downward trending line.
- A value approaching 0 indicates no discernible linear trend between the variables.
However, a crucial note is that correlation doesn’t signify causation. A strong correlation doesn’t necessarily indicate that one variable caused the other.
4. Calculate Correlation Using Python
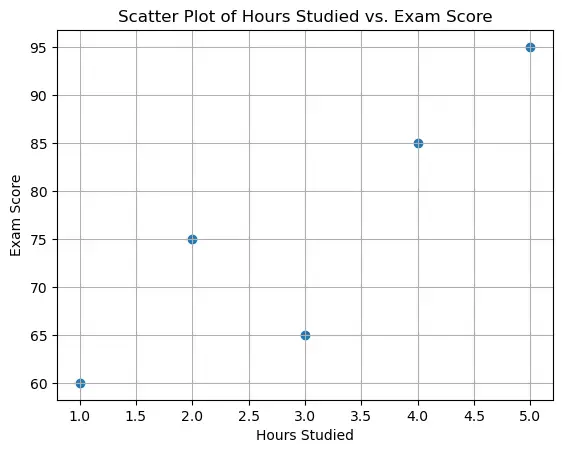
Let’s assume you’re a teacher who wants to understand if there’s a relationship between the hours a student studies and their exam scores.
Scenario: You have data on 5 students: hours studied and their corresponding exam scores.
# Python code to demonstrate correlation calculation

# Importing required libraries
import numpy as np
import pandas as pd

# Data
data = {
    'Hours_Studied': [1, 2, 3, 4, 5],
    'Exam_Score': [60, 75, 65, 85, 95]
}

# Convert to DataFrame
df = pd.DataFrame(data)

# Calculate Pearson correlation
correlation = df['Hours_Studied'].corr(df['Exam_Score'])
print(f'Correlation between Hours Studied and Exam Score is: {correlation:.2f}')
Correlation between Hours Studied and Exam Score is: 0.88
This output suggests a strong positive correlation between study hours and exam scores.
4.1. Visualize Correlations
A scatter plot is a common way.
import matplotlib.pyplot as plt

plt.scatter(df['Hours_Studied'], df['Exam_Score'])
plt.title('Scatter Plot of Hours Studied vs. Exam Score')
plt.xlabel('Hours Studied')
plt.ylabel('Exam Score')
plt.grid(True)
plt.show()

4.2. Test for Significance in Correlation
It helps to determine if the observed correlation is statistically significant. This means we’re reasonably sure the correlation is real and not due to chance.
from scipy.stats import pearsonr

corr_coefficient, p_value = pearsonr(df['Hours_Studied'], df['Exam_Score'])

print(f'Correlation Coefficient: {corr_coefficient:.2f}')
print(f'P-value: {p_value:.5f}')
Correlation Coefficient: 0.88
P-value: 0.04692
If the p-value is below a threshold (commonly 0.05), the correlation is considered statistically significant.
4.3. Handle Multiple Correlations
In real-world datasets, you might want to check correlations between multiple variables. This can be done using a correlation matrix.
import pandas as pd
url = 'https://raw.githubusercontent.com/selva86/datasets/master/Iris.csv'
iris = pd.read_csv(url)

correlation_matrix = iris.iloc[:,1:].corr()
print(correlation_matrix)
               SepalLengthCm  SepalWidthCm  PetalLengthCm  PetalWidthCm
SepalLengthCm       1.000000     -0.109369       0.871754      0.817954
SepalWidthCm       -0.109369      1.000000      -0.420516     -0.356544
PetalLengthCm       0.871754     -0.420516       1.000000      0.962757
PetalWidthCm        0.817954     -0.356544       0.962757      1.000000
4.4. Visualizing the Correlation Matrix with a Heatmap
Visualizing multiple correlations using a heatmap is a common and insightful way to quickly grasp relationships between multiple variables in a dataset. We’ll use the Python libraries like pandas and seaborn, to display these correlations.
For larger datasets, visualizing this matrix as a heatmap can be insightful.
import seaborn as sns

plt.figure(figsize=(6,3), dpi =100)
sns.heatmap(correlation_matrix ,annot=True, linewidth=.5)
plt.title('Correlation Heatmap of Student Performance Metrics')
plt.show()

annot=Trueensures that the correlation values appear on the heatmap.cmapspecifies the color palette. In this case, we’ve chosen ‘coolwarm’, but there are various palettes available in seaborn.linewidthsdetermines the width of the lines that will divide each cell.vminandvmaxare used to anchor the colormap, ensuring that the center is set at a meaningful value.
4.5. How to Account for Non-Linear Correlations?
Pearson’s correlation coefficient captures linear relationships. But what if the relationship is curved or nonlinear? Enter Spearman’s rank correlation. It’s based on ranked values rather than raw data.
spearman_corr = df['Hours_Studied'].corr(df['Exam_Score'], method='spearman')
print(f"Spearman's Correlation: {spearman_corr:.2f}")
Spearman's Correlation: 0.90
5. Difference Between Correlation and Causation?
It’s vital to note that correlation does not imply causation. Just because two variables are correlated doesn’t mean one caused the other. Using our example, while hours studied and exam scores are correlated, it doesn’t mean studying longer always causes better scores. Other factors might play a role.
6. Conclusion
Correlation is a powerful tool in data science, offering insights into relationships between variables. But it’s crucial to use it judiciously and remember that correlation doesn’t equate to causation. Python, with its rich library ecosystem, provides a many tools and methods to efficiently calculate, visualize, and interpret correlations.
The key is to understand the data, choose the appropriate correlation measure, and always be aware of the underlying assumptions.


