Let’s dive into the concept of deciles and quartiles and how to calculate them in PySpark.
When analyzing data, it’s important to understand the distribution of the data. One way to do this is by calculating the deciles and quartiles.
What are Deciles?
Deciles divide a set of data into 10 equal parts. For example, the first decile (D1) is the point at which 10% of the data is below that point, the second decile (D2) is the point at which 20% of the data is below that point, and so on, up to the 10th decile (D10), which is the point at which 100% of the data is below that point.
What are Quartiles?
Quartiles divide a set of data into 4 equal parts. The first quartile (Q1) is the point at which 25% of the data is below that point, the second quartile (Q2) is the point at which 50% of the data is below that point (also known as the median), and the third quartile (Q3) is the point at which 75% of the data is below that point.
Importance of Deciles and Quartiles in Statistics and Machine Learning
Deciles and percentiles are measures of relative standing in a dataset, dividing the data into equal parts. They are essential tools in statistics and machine learning for summarizing, analyzing, and comparing data. Here are some common uses of deciles and percentiles in both fields:
1. Identify central tendencies: Deciles help determine the median (5th decile), which is a measure of central tendency that can be more robust to outliers than the mean.
2. Assess data dispersion: By calculating the decile range (9th decile – 1st decile), you can measure the dispersion or spread of the data, providing insights into the variability within the dataset.
3. Compare datasets or groups: Deciles can be used to compare different datasets or groups by examining their decile values and how they are distributed.
4. Identify trends and patterns: Deciles help to reveal trends and patterns within the data, which can inform decision-making and further analysis.
5. Segment data: Deciles can be used to segment data into groups, such as dividing a population into income or performance groups, for targeted analysis or interventions.
6. Detect outliers: By examining extreme decile values, you can identify potential outliers in the dataset.
1. Import required libraries and initialize SparkSession
First, let’s import the necessary libraries and create a SparkSession, the entry point to use PySpark.
import findspark
findspark.init()

from pyspark import SparkFiles
from pyspark.sql import SparkSession
from pyspark.sql.functions import mean, stddev, col

spark = SparkSession.builder.appName("Deciles and Quantiles").getOrCreate()
2. Preparing the Sample Data
To demonstrate the different methods of calculating the Deciles and Quantiles, we’ll use a sample dataset containing three columns. First, let’s load the data into a DataFrame:
url = "https://raw.githubusercontent.com/selva86/datasets/master/Iris.csv"
spark.sparkContext.addFile(url)

df = spark.read.csv(SparkFiles.get("Iris.csv"), header=True, inferSchema=True)
df.show(5)
+---+-------------+------------+-------------+------------+-----------+
| Id|SepalLengthCm|SepalWidthCm|PetalLengthCm|PetalWidthCm|    Species|
+---+-------------+------------+-------------+------------+-----------+
|  1|          5.1|         3.5|          1.4|         0.2|Iris-setosa|
|  2|          4.9|         3.0|          1.4|         0.2|Iris-setosa|
|  3|          4.7|         3.2|          1.3|         0.2|Iris-setosa|
|  4|          4.6|         3.1|          1.5|         0.2|Iris-setosa|
|  5|          5.0|         3.6|          1.4|         0.2|Iris-setosa|
+---+-------------+------------+-------------+------------+-----------+
only showing top 5 rows
3. How to calculate deciles and quantiles Using approxQuantile on a single column
you can calculate deciles and quantiles using the approxQuantile function, which is available in the DataFrame API. Here are three different ways to calculate deciles and quantiles using PySpark
# Calculate the deciles (10-quantiles) for the "Value" column
deciles = df.approxQuantile("SepalLengthCm", [x / 10 for x in range(1, 10)], 0.0)

# Calculate the quantiles (4-quantiles) for the "Value" column
quantiles = df.approxQuantile("SepalLengthCm", [0.25, 0.5, 0.75], 0.0)

print("Deciles:", deciles)
print("Quantiles:", quantiles)
Deciles: [4.8, 5.0, 5.2, 5.6, 5.8, 6.1, 6.3, 6.5, 6.9]
Quantiles: [5.1, 5.8, 6.4]
4. How to calculate deciles and quantiles Using approxQuantile on multiple columns
# Calculate deciles and quantiles for multiple columns
deciles = {}
quantiles = {}

for col in ["SepalLengthCm", "PetalLengthCm"]:
    deciles[col] = df.approxQuantile(col, [x / 10 for x in range(1, 10)], 0.0)
    quantiles[col] = df.approxQuantile(col, [0.25, 0.5, 0.75], 0.0)

print("Deciles:", deciles)
print("Quantiles:", quantiles)
Deciles: {'SepalLengthCm': [4.8, 5.0, 5.2, 5.6, 5.8, 6.1, 6.3, 6.5, 6.9], 'PetalLengthCm': [1.4, 1.5, 1.7, 3.9, 4.3, 4.6, 5.0, 5.3, 5.8]}
Quantiles: {'SepalLengthCm': [5.1, 5.8, 6.4], 'PetalLengthCm': [1.6, 4.3, 5.1]}
5. Deciles and Quantiles use case
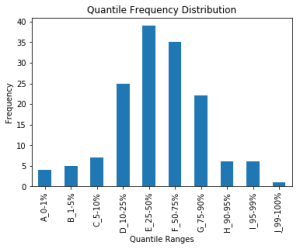
By examining quantile frequency distribution and extreme quantile values, you can identify potential outliers in the dataset
and also identfy the skewness in the data
import pyspark.sql.functions as F
import matplotlib.pyplot as plt
import pandas as pd

column_name = "SepalLengthCm"
quantiles = [0.0, 0.01, 0.05, 0.10, 0.25, 0.5, 0.75, 0.90, 0.95, 0.99, 1.0]
quantile_values = df.approxQuantile(column_name, quantiles, 0.001)

print(quantile_values)
[4.3, 4.4, 4.6, 4.8, 5.1, 5.8, 6.4, 6.9, 7.3, 7.7, 7.9]
Create a new DataFrame with the quantile values and their corresponding frequency.
quantile_frequency = df.select(F.when(F.col(column_name).between(quantile_values[0], quantile_values[1]), "A_0-1%")
                                .when(F.col(column_name).between(quantile_values[1], quantile_values[2]), "B_1-5%")
                                .when(F.col(column_name).between(quantile_values[2], quantile_values[3]), "C_5-10%")
                                .when(F.col(column_name).between(quantile_values[3], quantile_values[4]), "D_10-25%")
                                .when(F.col(column_name).between(quantile_values[4], quantile_values[5]), "E_25-50%")
                                .when(F.col(column_name).between(quantile_values[5], quantile_values[6]), "F_50-75%")
                                .when(F.col(column_name).between(quantile_values[6], quantile_values[7]), "G_75-90%")
                                .when(F.col(column_name).between(quantile_values[7], quantile_values[8]), "H_90-95%")
                                .when(F.col(column_name).between(quantile_values[8], quantile_values[9]), "I_95-99%")
                                .otherwise("J_99-100%")
                                .alias("quantile_range"))

quantile_frequency_count = quantile_frequency.groupBy("quantile_range").count().orderBy("quantile_range").toPandas()

display(quantile_frequency_count)
| quantile_range | count | |
|---|---|---|
| 0 | A_0-1% | 4 |
| 1 | B_1-5% | 5 |
| 2 | C_5-10% | 7 |
| 3 | D_10-25% | 25 |
| 4 | E_25-50% | 39 |
| 5 | F_50-75% | 35 |
| 6 | G_75-90% | 22 |
| 7 | H_90-95% | 6 |
| 8 | I_95-99% | 6 |
| 9 | J_99-100% | 1 |
quantile_frequency_count.plot(x="quantile_range", y="count", kind="bar", legend=None)
plt.xlabel("Quantile Ranges")
plt.ylabel("Frequency")
plt.title("Quantile Frequency Distribution")
plt.show()

Conclusion
Deciles and quartiles are important measures of the distribution of data. In PySpark, we can easily calculate these measures using the approxQuantile method from the pyspark.sql.functions module.


