Granger Causality test is a statistical test that is used to determine if a given time series and it’s lags is helpful in explaining the value of another series. You can implement this in Python using the statsmodels package.
That is, the Granger Causality can be used to check if a given series is a leading indicator of a series we want to forecast/predict.
How to implement Granger Causality Test in Python
You can implement Granger Causality test using the grangercausalitytests function present in the statsmodels library.
Let’s start by importing the packages.
import pandas as pd
import numpy as np
import matplotlib.pyplot as plt
import warnings
warnings.filterwarnings('ignore')
%matplotlib inline
Read the dataset: BJsales
df = pd.read_csv("BJsales.csv")
print(df.shape)
df.head()
(150, 2)
| BJSales | Bjsales_lead | |
|---|---|---|
| 0 | 200.1 | 10.01 |
| 1 | 199.5 | 10.07 |
| 2 | 199.4 | 10.32 |
| 3 | 198.9 | 9.75 |
| 4 | 199.0 | 10.33 |
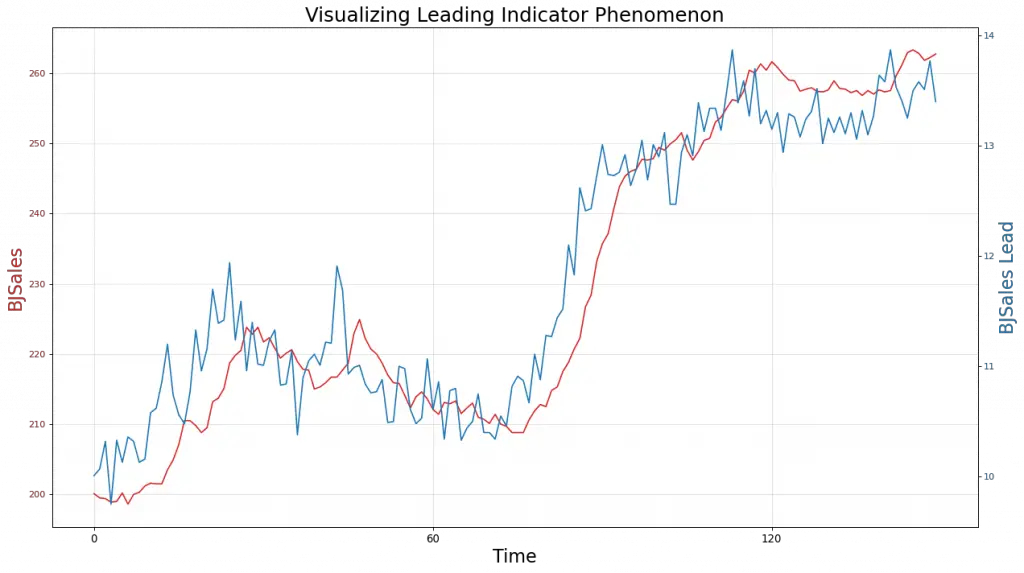
Visualize the Lead effect in the time series
x = df.index
y1 = df['BJSales']
y2 = df['Bjsales_lead']

# Plot Line1 (Left Y Axis)
fig, ax1 = plt.subplots(1,1,figsize=(16,9), dpi= 80)
ax1.plot(x, y1, color='tab:red')

# Plot Line2 (Right Y Axis)
ax2 = ax1.twinx()  # instantiate a second axes that shares the same x-axis
ax2.plot(x, y2, color='tab:blue')

# Decorations
# ax1 (left Y axis)
ax1.set_xlabel('Time', fontsize=20)
ax1.tick_params(axis='x', rotation=0, labelsize=12)
ax1.set_ylabel('BJSales', color='tab:red', fontsize=20)
ax1.tick_params(axis='y', rotation=0, labelcolor='tab:red' )
ax1.grid(alpha=.4)

# ax2 (right Y axis)
ax2.set_ylabel("BJSales Lead", color='tab:blue', fontsize=20)
ax2.tick_params(axis='y', labelcolor='tab:blue')
ax2.set_xticks(np.arange(0, len(x), 60))
ax2.set_xticklabels(x[::60], rotation=90, fontdict={'fontsize':10})
ax2.set_title("Visualizing Leading Indicator Phenomenon", fontsize=22)
fig.tight_layout()
plt.show()
The above chart is a template borrowed from the Top 50 Matplotlib Visualizations.
The Granger Causality Test Function in Python Statsmodels
from statsmodels.tsa.stattools import grangercausalitytests
Let’s look at the help of grangercausalitytests
?grangercausalitytests
Signature: grangercausalitytests(x, maxlag, addconst=True, verbose=None)
Docstring:
Four tests for granger non causality of 2 time series.

All four tests give similar results. `params_ftest` and `ssr_ftest` are
equivalent based on F test which is identical to lmtest:grangertest in R.

Parameters
----------
x : array_like
    The data for testing whether the time series in the second column Granger
    causes the time series in the first column. Missing values are not
    supported.
maxlag : {int, Iterable[int]}
    If an integer, computes the test for all lags up to maxlag. If an
    iterable, computes the tests only for the lags in maxlag.
addconst : bool
    Include a constant in the model.
verbose : bool
    Print results. Deprecated

    .. deprecated: 0.14

       verbose is deprecated and will be removed after 0.15 is released


Returns
-------
dict
    All test results, dictionary keys are the number of lags. For each
    lag the values are a tuple, with the first element a dictionary with
    test statistic, pvalues, degrees of freedom, the second element are
    the OLS estimation results for the restricted model, the unrestricted
    model and the restriction (contrast) matrix for the parameter f_test.

Notes
-----
The Null hypothesis for grangercausalitytests is that the time series in
the second column, x2, does NOT Granger cause the time series in the first
column, x1. Grange causality means that past values of x2 have a
statistically significant effect on the current value of x1, taking past
values of x1 into account as regressors. We reject the null hypothesis
that x2 does not Granger cause x1 if the pvalues are below a desired size
of the test.

The null hypothesis for all four test is that the coefficients
corresponding to past values of the second time series are zero.

`params_ftest`, `ssr_ftest` are based on F distribution

`ssr_chi2test`, `lrtest` are based on chi-square distribution


Examples
--------
>>> import statsmodels.api as sm
>>> from statsmodels.tsa.stattools import grangercausalitytests
>>> import numpy as np
>>> data = sm.datasets.macrodata.load_pandas()
>>> data = data.data[["realgdp", "realcons"]].pct_change().dropna()

All lags up to 4
>>> gc_res = grangercausalitytests(data, 4)

Only lag 4
>>> gc_res = grangercausalitytests(data, [4])
Now, define the maximum number of lags to include in the test.
maxlag = 12
test   = 'ssr_chi2test'
As stated, the Null hypothesis is that the BJSales Lead, does NOT Granger cause BJSales.
Run the Granger Causality Test
The grangers_causation_matrix function defined below is designed to perform the test on multiple combinations of variables in one shot. That is, it tries to perform the Granger Causality test for all pairs of variables present in the input dataset.
def grangers_causation_matrix(data, variables, test='ssr_chi2test', verbose=False):
    """Check Granger Causality of all possible combinations of the Time series.
    The rows are the response variable, columns are predictors. The values in the table
    are the P-Values. P-Values lesser than the significance level (0.05), implies
    the Null Hypothesis that the coefficients of the corresponding past values is
    zero, that is, the X does not cause Y can be rejected.

    data      : pandas dataframe containing the time series variables
    variables : list containing names of the time series variables.
    """
    df = pd.DataFrame(np.zeros((len(variables), len(variables))), columns=variables, index=variables)
    for c in df.columns:
        for r in df.index:
            test_result = grangercausalitytests(data[[r, c]], maxlag=maxlag, verbose=False)
            p_values = [round(test_result[i+1][0][test][1],4) for i in range(maxlag)]
            if verbose: print(f'Y = {r}, X = {c}, P Values = {p_values}')
            min_p_value = np.min(p_values)
            df.loc[r, c] = min_p_value
    df.columns = [var + '_x' for var in variables]
    df.index = [var + '_y' for var in variables]
    return df
The output contains the p-values of the Granger causality test, with the X and Y variables shown in the columns and rows respectively.
grangers_causation_matrix(df, variables = df.columns)
| BJSales_x | Bjsales_lead_x | |
|---|---|---|
| BJSales_y | 1.0000 | 0.0 |
| Bjsales_lead_y | 0.0002 | 1.0 |
How to interpret the p-values?
Assuming a significance level of 0.05, if the p-value is lesser than 0.05, then we do NOT reject the null hypothesis that X does NOT granger cause Y.
So, in the above table, the p-value for X=Bjsales_lead and Y=BJSales is 0.0. So we reject the null hypothesis and conclude that X (BJSales_Lead) granger causes Y (BJSales).
That means, BJSales_lead will likely be helpful in predicting the BJSales, which confirms what we saw in the dual times series chart earlier.


