#pandas pivot #pandas pivot table
Pivot table in pandas is an excellent tool to summarize one or more numeric variable based on two other categorical variables.
Pivot tables in pandas are popularly seen in MS Excel files. In python, Pivot tables of pandas dataframes can be created using the command: pandas.pivot_table.
You can aggregate a numeric column as a cross tabulation against two categorical columns. In this article, you’ll see how to create pivot tables in pandas and understand its parameters with worked out examples.
pandas.pivot_table
Syntax
pandas.pivot_table(data, values=None, index=None, columns=None, aggfunc=’mean’, fill_value=None, margins=False, dropna=True, margins_name=’All’, observed=False)
Purpose:
Create a spreadsheet-style pivot table as a DataFrame. The levels in the pivot table of pandas will be stored in MultiIndex objects (hierarchical indexes) on the index and columns of the result DataFrame
Parameters:
data: Dataframe, The dataset whose pivot table is to be made.
values: Column, The feature whose statistical summary is to be seen.
index: Column, Used for indexing the feature passed in the values argument
columns: Column, Used for aggregating the values according to certain features
observed bool, (default False): This parameter is only applicable for categorical features. If it is set to ‘True’ then the table will show values only for categorical groups
Returns:
DataFrame, An Excel style pivot table
How to make a pivot table?
Use the pd.pivot_table() function and specify what feature should go in the rows and columns using the index and columns parameters respectively. The feature that should be used to fill in the cell values should be specified in the values parameter.
Let’s create a sample dataset.
import pandas as pd
import numpy as np

df = pd.DataFrame({'First Name': ['Aryan', 'Rohan', 'Riya', 'Yash', 'Siddhant', ],
                   'Last Name': ['Singh', 'Agarwal', 'Shah', 'Bhatia', 'Khanna'],
                   'Type': ['Full-time Employee', 'Intern', 'Full-time Employee',
                            'Part-time Employee', 'Full-time Employee'],
                   'Department': ['Administration', 'Technical', 'Administration',
                                  'Technical', 'Management'],
                   'YoE': [2, 3, 5, 7, 6],
                   'Salary': [20000, 5000, 10000, 10000, 20000]})

df
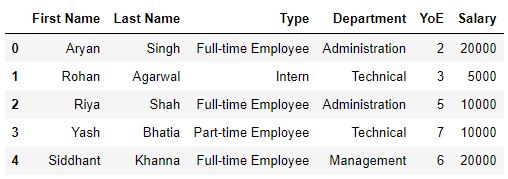
Use pd.pivot_table and specify the data, index, columns, aggfunc and `values` parameters.
output = pd.pivot_table(data=df,
                        index=['Type'],
                        columns=['Department'],
                        values='Salary',
                        aggfunc='mean')
output
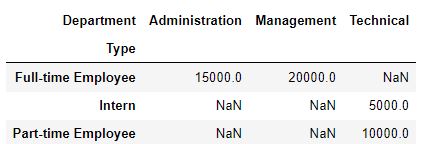
Here, we have made a basic pivot table in pandas which shows the average salary of each type of employee for each department. As there are no user-defined parameters passed, the remaining arguments have assumed their default values.
We can also make pivot tables which show multiple statistical values at the same time.
Pivot table with multiple aggregation functions
If column parameter is not specified, it will aggregate based on the index.
# Pivot table with multiple aggfuncs
output = pd.pivot_table(data=df, index=['Type'],
                        values='Salary',
                        aggfunc=['sum', 'mean', 'count'])
output
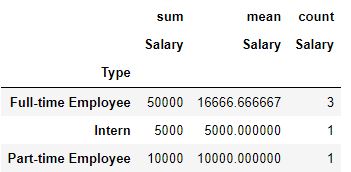
Here, the pivot table shows the sum and mean of the salaries of each type of employee and the number of employees of each type.
How to calculate row and column grand totals in pivot_table?
Now, let’s take a look at the grand total of the salary of each type of employee. For this, we will use the margins and the margins_name parameter.
# Calculate row and column totals (margins)
output = pd.pivot_table(data=df, index=['Type'],
                        values='Salary',
                        aggfunc=['sum', 'mean', 'count'],
                        margins=True,
                        margins_name='Grand Total')
output
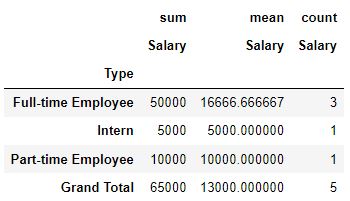
How to aggregate for multiple features in pivot table?
We can also perform different aggregations on different features. This helps in applying appropriate operations on different features without having to create multiple pivot tables.
# Aggregating for multiple features
output = pd.pivot_table(data=df, index='Type', values=['Salary', 'YoE'],
                        columns=['Department'],
                        aggfunc={'Salary': np.sum, 'YoE': np.mean})
output

Replacing missing values
In the last table of the previous section, we could see the total salary received by the employees in each department and the average experience of the employees in each department.
However, there are NaNs present in that table.
We can replace the NaNs with a suitable value using the fill_value parameter. In this case, we will be replacing the NaN with ‘Not Applicable’.
# Replacing missing values
output = pd.pivot_table(data=df, index='Type', values=['Salary', 'YoE'],
                        columns=['Department'],
                        aggfunc={'Salary': np.sum, 'YoE': np.mean},
                        fill_value='Not applicable')

output

The fill_value parameter can be used to replace NaNs with any suitable value including the mean, median or mode of other features.
Multi-level index pivot tables
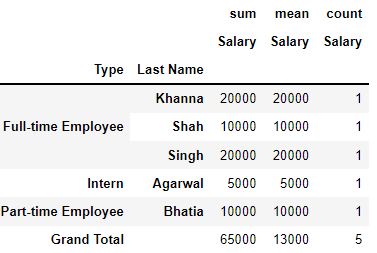
The above pivot tables were made using a single level index i.e., only one feature as the index was used. However, we can also multiple indices to make our pivot tables. Multi-level index pivot table show the summary details in greater granularity and they can be very useful when we are dealing with hierarchical data.
# Passing Type and then Last Name as indices
output = pd.pivot_table(data=df, index=['Type', 'Last Name'],
                        values='Salary',
                        aggfunc=['sum', 'mean', 'count'],
                        margins=True,
                        margins_name='Grand Total')
output
Practical Tips
Pivot tables can be a very handy tool for data analysis. Here are a few tips which can help you with using pivot tables to their maximum potential.
Generating Insights: Pivot Tables can give a snapshot view of the entire dataset which eases the process of inferring useful insights and making important observations in the dataset.
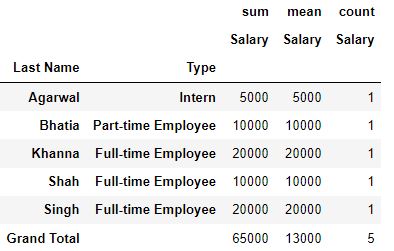
Ordering multi-level index pivot tables: The order in which the features are passed as index to the pivot table can affect the values displayed in the table.
# Passing Last Name and then Type as indices
output = pd.pivot_table(data=df, index=['Last Name', 'Type'],
                        values='Salary',
                        aggfunc=['sum', 'mean', 'count'],
                        margins=True,
                        margins_name='Grand Total')
output
# Passing Type and then Last Name as indices
type_pivot_table = pd.pivot_table(data=df,
                                  index=['Type', 'Last Name'],
                                  values='Salary',
                                  aggfunc=['sum', 'mean', 'count'],
                                  margins=True,
                                  margins_name='Grand Total')
type_pivot_table

GroupBy function
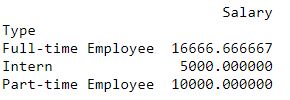
Pivot tables are similar to the pandas DataFrame.groupby() method which is also used for viewing the statistical characteristics of a feature in a dataset.
However, it should be kept in mind that the object returned by the groupby() function is a DataFrameGroupBy object instead of a dataframe. Hence, conventional dataframe operations will not work on this object.
# Pivot tables
output = pd.pivot_table(data=df,
                        index=['Type'],
                        values='Salary')
print(output)
# Example of a groupby function

grouped_pivot_table = df[['Salary', 'Department', 'Type']].groupby(['Type'])
print(grouped_pivot_table)

print(type(output))
print(type(grouped_pivot_table))

Conclusion
We saw how to make a pivot table of a pandas dataframe and how to configure its parameters for viewing the statistical details at varying levels of granularity.
Test your knowledge
Q1: In a multi-index pivot table, the order in which the indices are passed does not matter. True or False?
Answer:
False. Because, the values displayed in the pivot table change depending on the order of the indices passed.
Q2: Which parameter is used for changing the method of aggregation in the pivot table?
Answer:
aggfunc
Q3: How can we view different aggregations on different features in the same pivot table?
Answer:
Pass the feature names and the aggregation operation to be performed as corresponding key-value pairs in a dictionary to the aggfunc function. Also, the feature names should also be passed to the values parameter.
Q4: Answer the following questions using the given dataset.
import pandas as pd
import numpy as np

df = pd.DataFrame({'First Name': ['Aryan', 'Rohan', 'Riya', 'Yash', 'Siddhant', ],
                   'Last Name': ['Singh', 'Agarwal', 'Shah', 'Bhatia', 'Khanna'],
                   'Type': ['Full-time Employee', 'Intern', 'Full-time Employee', 'Part-time Employee', 'Full-time Employee'],
                   'Department': ['Administration', 'Technical', 'Administration', 'Technical', 'Management'],
                   'YoE': [2, 3, 5, 7, 6],
                   'Salary': [20000, 5000, 10000, 10000, 20000]})

df

Q4.1: What is the average years of experience each type of employee has in each department? Show the pivot table indexing using employment type.
Answer:
pd.pivot_table(data=df, index=['Type'], values='YoE', columns=['Department'])

Q4.2: Make a pivot table which shows the average salaries as well as the number of employees across different departments. They should be indexed by the employment type.
Answer:
pd.pivot_table(data=df, index=['Type'], columns=[
               'Department'], values='Salary', aggfunc=[np.mean, 'count'])

Q4.3: Make a pivot table which shows the average salary of each type of employee in each department and the sum of the total years of experience (YoE) of each employee in each department.
Answer:
pd.pivot_table(data=df, index=['Department', 'Type'], values=[
               'Salary', 'YoE'], aggfunc=({'Salary': np.mean, 'YoE': np.sum}))

This article was contributed by Shreyansh.


