How to use Pandas Describe function?
The pandas.describe function is used to get a descriptive statistics summary of a given dataframe. This includes mean, count, std deviation, percentiles, and min-max values of all the features.
In this article, you will learn about different features of the describe function. We will also learn about the parameters of the function in depth.
pandas.describe
- Syntax: pandas.describe(percentiles=None, include=None, exclude=None, datetime_is_numeric=False)Purpose: Generate descriptive statistics. Descriptive statistics include those that summarize the central tendency, dispersion and shape of a dataset’s distribution, excluding NaN values. Analyzes both numeric and object series, as well as DataFrame column sets of mixed data types.
- Parameters:
- percentiles:list-like of numbers The percentiles to include in the output. All should fall between 0 and 1. The default is [.25, .5, .75], which returns the 25th, 50th, and 75th percentiles.
- include:‘all’, list-like of dtypes or None (default) A white list of data types to include in the result. ‘all’: All columns of the input will be included in the output, A list-like of dtypes : Limits the results to the provided data types, None (default) : The result will include all numeric columns.
- exclude:ist-like of dtypes or None (default) A black list of data types to omit from the result. A list-like of dtypes : Excludes the provided data types from the result, None (default) : The result will exclude nothing.
- datetime_is_numeric:bool, default False Whether to treat datetime dtypes as numeric. This affects statistics calculated for the column. For DataFrame input, this also controls whether datetime columns are included by default.
- Returns : Series or DataFrame Summary statistics of the Series or Dataframe provided.
# Import Packages
import pandas as pd
import warnings

warnings.filterwarnings("ignore")
Pandas Describe Function
The Describe function returns the statistical summary of the dataframe or series. This includes count, mean, median (or 50th percentile) standard variation, min-max, and percentile values of columns. To perform this function, chain .describe() to the dataframe or series.
1. Pandas Describe function on Series
When pandas describe function is applied to a series object, the result is also returned in the form of series
# Create a Series
numericSeries = pd.Series([1,4,6,53,2,2,1,1])

# Apply describe function
numericSeries.describe()
count     8.000000
mean      8.750000
std      17.966238
min       1.000000
25%       1.000000
50%       2.000000
75%       4.500000
max      53.000000
dtype: float64
2. Pandas Describe function on DataFrame
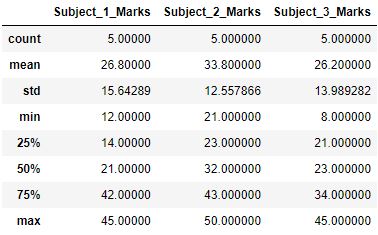
On applying pandas describe function to a dataframe, the result is also returned as a dataframe . This dataframe will consist of a statistics summary for all the numeric features of the dataframe.
# Create a dataframe
df = pd.DataFrame({
                    'Subject_1_Marks': [14, 42, 21, 12, 45],
                    'Subject_2_Marks': [32, 43, 23, 50, 21],
                    'Subject_3_Marks': [45.0, 34.0, 23.0, 8.0, 21.0],
                    'Names': ['Saksham', 'Ayushi', 'Abhishek', 'Saksham', 'Saumya']
                    }
                 )

# Apply describe function
df.describe()
How to get summary for non-numeric features?
Sometimes, we have non-numeric features also. Have a look at the data types of the features of the example dataset:
df.dtypes
Subject_1_Marks      int64
Subject_2_Marks      int64
Subject_3_Marks    float64
Names               object
dtype: object
By default, the describe function only returns the summary for numeric features of the dataset. To get a summary for other data types, you can tweak the include parameter of the describe function.
1. Include='all' parameter
Specifying include='all' will force pandas to generate summaries for all types of features in the dataframe. Some data types like string type don’t have any mean or standard deviation. In such cases, pandas will mark them as NaN.
# describe function with include='all'

df.describe(include='all')
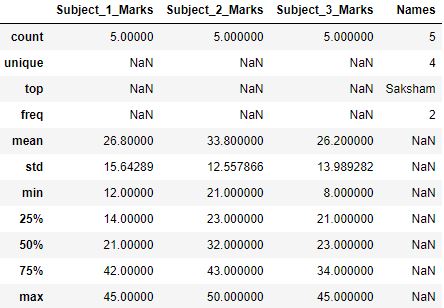
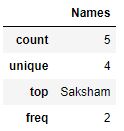
You can see that the describe function returns different features such as unique values, top value, and its frequency for the string type data (Names column). It returns the same set of features for categorical data type features.
2. List of data types for include parameter
Alternatively, you can also specify data types to be included in the summary using include parameter. Pandas will generate summaries only for those data types that are present in the include parameter list.
# describe function with include= ['object']
df.describe(include=['object'])
How to exclude data types from the summary?
You can blacklist the data types from being included in the summary. exclude parameter takes the list of all such data types.
# describe function with exclude= ['float']
df.describe(exclude=['float'])
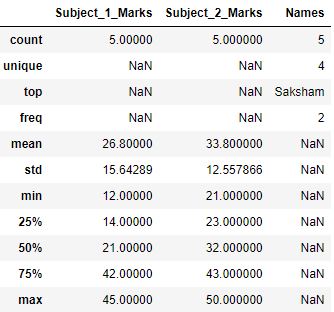
In our example dataframe, Subject_3_Marks is float64 and that’s why it was not included in the above summary.
Customize Percentiles of Pandas Describe function
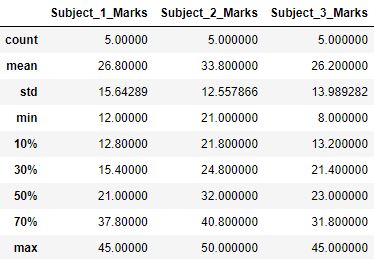
The default percentiles of the describe function are 25th, 50th, and 75th percentile or (0.25, 0.5, and 0.75). You can pass your own percentiles to the pandas describe function using the percentiles parameter. It takes in the list of all the percentiles (between 0 to 1).
Note: 50th percentile will be included in any of the cases as 50th percentile also denotes median
# describe function with percentiles=[0.1, 0.3, 0.7]
df.describe(percentiles=[0.1, 0.3, 0.7])
Treat DateTime values as numeric
By default,pandas datetime values are treated as datetime objects. The summary for such objects includes the first date, last date, count, unique values, top value and its frequency.
# create a datetime series
series = pd.date_range(start='27/05/2021', periods=len(df))

# adding dates series to dataframe
df['dates'] = series

# describe function on dates
df.dates.describe()
count                       5
unique                      5
top       2021-05-28 00:00:00
freq                        1
first     2021-05-27 00:00:00
last      2021-05-31 00:00:00
Name: dates, dtype: object
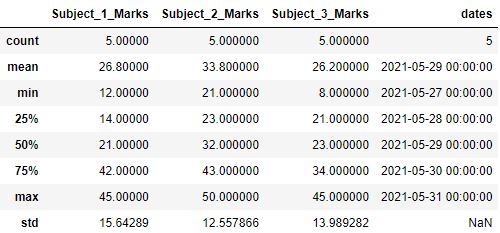
You can make pandas recognize date-time values as numeric using datetime_is_numeric. It takes the boolean value as True/False. Let’s understand with an example.
# describe function with datetime_is_numeric=True
df.describe(datetime_is_numeric=True)
Practical Tips
- It is a good practice to look at the descriptive statistics of the dataset before moving ahead for further analysis. For instance, a feature with 0 standard variances may not be useful. 0 std indicates that all the values of the feature column are the same.
Test your knowledge
Q1: Median is missing from the describe function. True or False?
Answer:Answer: False. The 50th percentile is the same as the median of the dataset.
Q2: How can you display a statistics summary for all data types?
Answer:Answer: By using include=all parameter. It displays summaries for all data types.
Q3: Which parameter is used to define custom percentiles other than the default ones?
Answer:Answer: percentiles parameter takes the list of all the percentiles scaled between 0 to 1.
To test your pandas fundamentals further, checkout our blog on pandas exercises here.
The article was contributed by Kaustubh G and Shrivarsheni


