Pandas provides you a quick and easy way to visualize the relationship between the features of a dataframe. The Pandas line plot represents information as a series of data points connected with a straight line. Very often, we use this to find out how a particular feature changes with respect to time and also with respect to one another.
pandas.dataframe.plot function can be used to directly create line plots from pandas dataframes. We will also cover how to create multiple plots, `DateTime` axis plots, and more.
Create a Sample Data set
Let us create a simple pandas dataframe, upon which we will create a line plot. Start by importing necessary libraries
# Import packages
import pandas as pd
import numpy as np
Create a simple dataframe having 5 columns or features. The first 3 columns are scores obtained in each subject, the fourth has the school name. The last column has the corresponding dates for each.
df = pd.DataFrame({
    'Subject_1': [70.5, 80.7, 50.4, 70.5, 80.9],
    'Subject_2': [40.24, 50.9, 70.6, 80.1, 50.9],
    'Subject_3': [30, 50.5, 70.8, 90.88, 30],
    'School': ['School_1', 'School_2', 'School_3', 'School_4', 'School_5'],
    'Date': ['2021/06/01', '2021/06/02', '2021/06/03', '2021/06/04', '2021/06/05']
})
df
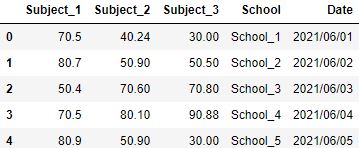
Pandas Line Plot using .plot() function
To create a line plot using pandas, chain the .plot() function to the dataframe. This function can be applied in the following ways:
Method 1: df.plot( ) defaults
By default, the kind parameter of plot function, that defines the type of plot to be created, takes the value as line. Therefore, you can directly chain the plot() function to the dataframe.
# Line Plot using 'plot' function on dataframe
df.plot();
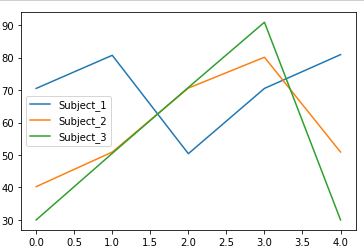
Note: Adding semicolon at the end of code suppresses text output from functions
Method 2: Using kind parameter
If you want to be sure the output is going to be a line plot, explicitly set `kind=’line’`.
# Line Plot using 'plot' function and kind=line parameter on dataframe
df.plot(kind='line');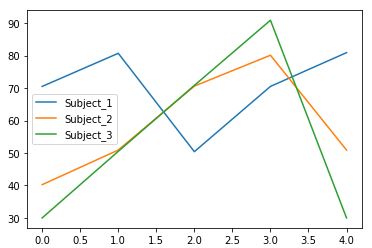
Method 3: Calling Line method from Plot function
Plot function is internally a PlotAccessor object.
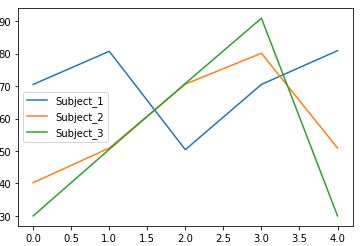
This means that one can directly call any method (type of plot in this case) from this function itself. For this case, chaining plot.line() function to the dataframe will return the matplotlib plot.
# Line Plot using 'line' method from plot function
df.plot.line();
Pandas Line Plot for Selective Columns
In the previous examples, you must have noticed that the pandas line plot was being generated for all the columns of the dataset. You can control this behavior by explicitly passing the column names that should go in the X and Y axis.
Simply pass the respective x and y positions to the plot. These parameters take the name of the column as value.
# line plot with x and y values defined
df.plot(x='School', y='Subject_1');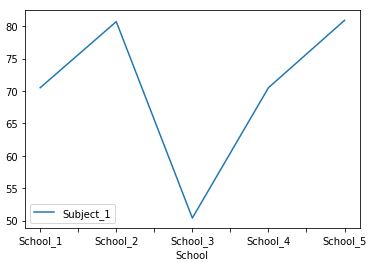
Multiple Pandas Line Plots (Alternative ways)
What happens when you call df.plot() on the raw dataframe?
Without any parameter, the plot() function returns the line plot for all the numeric columns of the dataset on the same axes. You can create similar plots on the same axes or even separate axes using basic matplotlib commands.
Multiple lines on same plot (axes)
For this, you need to create an axes object. Next, create different plots for every desirable feature. Then, pass the axes object to all the plot functions using ax parameter.
# Setup matplotlib
import matplotlib.pyplot as plt

# Create an axes object
axes = plt.gca()

# pass the axes object to plot function
df.plot(kind='line', x='School', y='Subject_1', ax=axes);
df.plot(kind='line', x='School', y='Subject_2', ax=axes);
df.plot(kind='line', x='School', y='Subject_3', ax=axes);
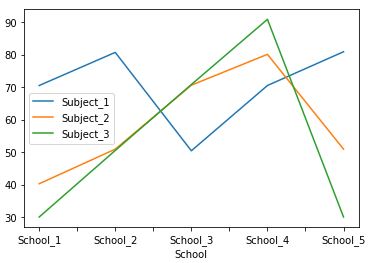
Multiple lines on separate plots (axes)
Separate axes means that the plots can have different x and y limits. Using subplots=True parameter, separate line plots are created for every numeric feature of the dataset without explicit call.
# line plots with subplots=True
df.plot(subplots=True);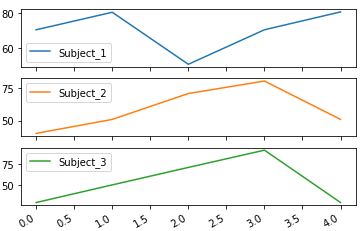
How to make Line plots with datetime in X axis?
Pandas Line plots can represent the change of a value across datetime. To effectively draw a line plot with datetime as axes, you need to follow these steps:
Step 1: Check if datetime values are in correct format
The datetime values should be of the form of pandas datetime objects. To convert the string dates to this format, use pd.to_datetime() function.
# Convert the string dates to pandas datetime format
df['Date'] = pd.to_datetime(df.Date)

df.Date
0 2021-06-01
1 2021-06-02
2 2021-06-03
3 2021-06-04
4 2021-06-05
Name: Date, dtype: datetime64[ns]
Step 2: Make datetime values index of the dataframe
Set the index of the dataframe to the datetime values column using the set_index function. This will eliminate the need to specifying the x-axes in line plots. Matplotlib will directly use pandas index to draw x-axes.
# Make datetime values as index
df.set_index('Date', inplace=True)
Step 3: Create the Line plot
When you create the pandas line plot for such dated-index dataframe, the plot will show the change of variable over datetime.
df.plot(y='Subject_2');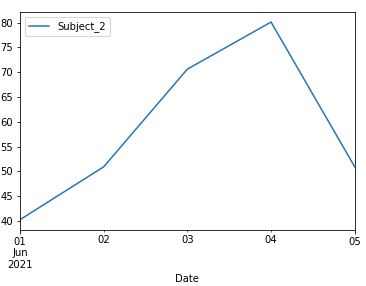
Practical Tips
- You should use pandas for quick plotting options to get instant data visualizations. This eliminates the need to use external libraries (though these plotting functions are using matplotlib under the hood)
- You can also use other parameters offered by matplotlib such as rotate x labels, title to improve the readability of the plots.
Test your knowledge
Q1: You can create line plots using:
a) pandas.dataframe.plot
b) pandas.dataframe.plot.line
c) pandas.dataframe.plot(kind='line')
d) All of the above
Answer:Answer: d) All of the above
Q2: What is the advantage of making datetime columns as an index?
Answer:Answer: It eliminates the need to explicitly specify the line plot’s ‘x’ axes. In such a case, matplotlib picks the index as ‘x’ axes.
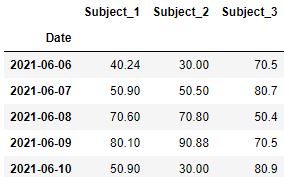
Q3: Consider the following dataframe:
# Creating dataframe
df = pd.DataFrame({
    'Subject_1': [40.24, 50.9, 70.6, 80.1, 50.9],
    'Subject_2': [30, 50.5, 70.8, 90.88, 30],
    'Subject_3': [70.5, 80.7, 50.4, 70.5, 80.9],
    'Date': ['2021/06/06', '2021/06/07', '2021/06/08', '2021/06/09', '2021/06/10']
})

# parsing datetime values as pandas datetime values
df['Date'] = pd.to_datetime(df.Date)

# making datetime values as index
df.set_index('Date', inplace=True)

df
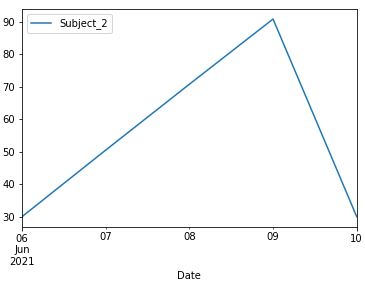
Create a line plot to show the trend of Subject_2 over the specified dates.
df.plot(y='Subject_2', kind='line');
This concludes the most common applications of the pandas line plot function. Hope you found it useful! If you would like to test your pandas knowledge, check out our blog on pandas exercises here.
The article was contributed by Kaustubh


