Pandas Groupby operation is used to perform aggregating and summarization operations on multiple columns of a pandas DataFrame. These operations can be splitting the data, applying a function, combining the results, etc.
In this article, you will learn how to group data points using groupby() function of a pandas DataFrame along with various methods that are available to view the different aspects of the groups.
pandas.DataFrame.groupby
- Syntax: DataFrame.groupby(by=None, axis=0, level=None, as_index=True, sort=True,group_keys=True, observed=False, dropna=True)
- Purpose: To split the data into groups having similar characteristics, apply a function on them, and return the results after combining them in a data structure.
- Parameters:
- by:mapping or function or label or list of labels (default:None). We use this to determine the groups that have similar characteristics.
- axis:0 or 1 (default: 0). We can use this to specify the orientation along which the DataFrame is to be split.
- level:Int or string or array (default:None). It is used to specify the name of the level in case the DataFrame has multi-level indices.
- as_index:Boolean (default: True). It is used to specify if the index of the output data structure should be the same as the group labels or not. This parameter is relevant only for a DataFrame input.
- sort:Boolean (default: True). It is used to specify if the output should be sorted according to the group keys or not. It does not affect the order of the observations within each group.
- group_keys:Boolean (default: True). We can use to determine if the group keys are to be added or not.
- observed:Boolean (default: False). It is used to specify if only the categorical groups are to be displayed or not. This parameter is applicable only if there is at least one categorical group.
- dropna:Boolean (default:True). It is used to specify if the NA values will be dropped from the group keys before returning the output or not. By default,they are dropped while making the groups.
- Returns: A groupby object containing the details of the groups formed in pandas.
How to use pandas groupby: A basic example
Create a simple dataframe as shown below with details of employees of different departments
# Create DataFrame
import pandas as pd

# Create the data of the DataFrame as a dictionary
data_df = {'Name': ['Asha', 'Harsh', 'Sourav', 'Riya', 'Hritik',
                    'Shivansh', 'Rohan', 'Akash', 'Soumya', 'Kartik'],

           'Department': ['Administration', 'Marketing', 'Technical', 'Technical', 'Marketing',
                          'Administration', 'Technical', 'Marketing', 'Technical', 'Administration'],

           'Employment Type': ['Full-time Employee', 'Intern', 'Intern', 'Part-time Employee', 'Part-time Employee',
                               'Full-time Employee', 'Full-time Employee', 'Intern', 'Intern', 'Full-time Employee'],

           'Salary': [120000, 50000, 70000, 70000, 55000,
                      120000, 125000, 60000, 50000, 120000],

           'Years of Experience': [5, 1, 2, 3, 4,
                                   7, 6, 2, 1, 6]}

# Create the DataFrame
df = pd.DataFrame(data_df)
df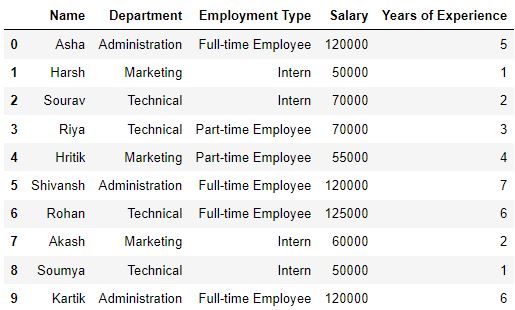
There are so many ways to create dataframes, if you don’t want to do it hard coded like above.
Now, use groupby function to group the data as per the ‘Department’ type as shown below.
# Use pandas groupby to group rows by department and get only employees of technical department
df_grouped = df.groupby('Department')

df_grouped.get_group('Technical')
Let us say you want to find the average salary of different departments, then take the ‘Salary’ column from the grouped df and take the mean.
# Group by department and find average salary of each group
df.groupby('Department')['Salary'].mean()
This is a common way of using the function. Now, let us dwell in depth about all the different ways possible.
The process of grouping the data
The process of grouping the data can be broken down into three steps:
- Splitting: Identify what column you want to do `groupby`. This is easily done using the
groupbymethod. - Applying: Apply the function or perform the operation for each group
- Combining: After applying the function, the results will be collected in one object.
Using a single key of groupby function in pandas
You can form groups using the groupby function using a single key (a ‘key’ is a column in the dataframe here) in pandas. The key can be a mapping, function or the name of a column in a pandas DataFrame.
In this case, the groupby key is a column named “Department”.
# Separate the rows into groups that have the same department
groups = df.groupby(by='Department')
You can view the different aspects of the output groups using multiple methods.
You can use the groups method to view the index labels of the rows that have the same group key value.
The output will be a dictionary where the keys of the dictionary are the group keys and the values of each key will be row index labels that have the same group key value.
# View the indices of the rows which are in the same group
print(groups.groups)
#> {'Administration': [0, 5, 9], 'Marketing': [1, 4, 7], 'Technical': [2, 3, 6, 8]}
As you can see, row indices 0, 5 and 9 have the group key value ‘Administration’, hence they have been grouped together.
Row indices 1, 4, 7 and 2, 3, 6, 8 have been grouped together as they have their common values: ‘Marketing’ and ‘Technical’ respectively.
Using multiple keys in groupby function in pandas
You can also use several keys for making groups in pandas using the groupby function of pandas by passing the list of keys to the by parameter.
# Separate the rows into groups that have the same Department and Employment Type
groups = df.groupby(by=['Department', 'Employment Type'])
View the groups using the groups method.
# View the indices of the rows which are in the same group
groups.groups
{('Administration', 'Full-time Employee'): [0, 5, 9], ('Marketing', 'Intern'): [1, 7], ('Marketing', 'Part-time Employee'): [4], ('Technical', 'Full-time Employee'): [6], ('Technical', 'Intern'): [2, 8], ('Technical', 'Part-time Employee'): [3]}
Iterating through the groups
You can use a ‘for’ loop to see the common group key value of each group as well as the rows of the pandas DataFrame which are a part of the same group.
# Separate the rows into groups that have the same department
groups = df.groupby(by='Department')

# View the name and the details of each group
for name, dept in groups:
    print(name)
    print(dept)
    print('\n')
Administration
       Name      Department     Employment Type  Salary  Years of Experience
0      Asha  Administration  Full-time Employee  120000                    5
5  Shivansh  Administration  Full-time Employee  120000                    7
9    Kartik  Administration  Full-time Employee  120000                    6


Marketing
     Name Department     Employment Type  Salary  Years of Experience
1   Harsh  Marketing              Intern   50000                    1
4  Hritik  Marketing  Part-time Employee   55000                    4
7   Akash  Marketing              Intern   60000                    2


Technical
     Name Department     Employment Type  Salary  Years of Experience
2  Sourav  Technical              Intern   70000                    2
3    Riya  Technical  Part-time Employee   70000                    3
6   Rohan  Technical  Full-time Employee  125000                    6
8  Soumya  Technical              Intern   50000                    1
Selecting a group
You can access the observations of that group by passing the group key value of a particular group to the get_group method,
# Separate the rows into groups that have the same department
groups = df.groupby('Department')

# View only that group whose group key value is 'Technical'
print(groups.get_group('Technical'))
     Name Department     Employment Type  Salary  Years of Experience
2  Sourav  Technical              Intern   70000                    2
3    Riya  Technical  Part-time Employee   70000                    3
6   Rohan  Technical  Full-time Employee  125000                    6
8  Soumya  Technical              Intern   50000                    1
Applying functions to a group
There are many functions which you can apply on the groups to get a statistical summary of the groups, transform the observations of the groups, or filter the groups based on a certain criteria.
We can classify the functions broadly into three categories:
-
Aggregation: These functions are used to compute different statistical values of the groups which can be useful for inferring insights about the trends or the pattern of observations present in the groups.
-
Transformation: These functions are used to make certain changes and adjustments to the observations of the group.
-
Filtration: These functions are used for subsetting the groups based on a certain criteria.
1. Aggregation
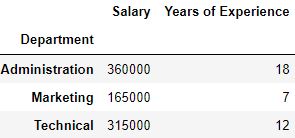
There are several aggregation functions that you can apply on the groups such as ‘sum’ to get the sum of numeric features of a group, ‘count’ to get the number of occurrences of each group or ‘mean’ to get the arithmetic mean of the numeric features of a group.
Use the aggregate method to apply the aggregation functions.
Example 1
# Separate the rows into groups that have the same department
groups = df.groupby(['Department'])

# View the sum of the numeric features of each group
groups.aggregate('sum')
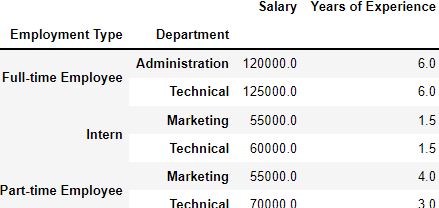
You can also apply aggregate functions on multiple keys by first making the groups with the keys and then passing the aggregation function to the method of the groups.
The keys passed form a multilevel index of the data structure which contains the output.
Example 2
# Separate the rows into groups that have the same department nad employment type
groups = df.groupby(['Employment Type', 'Department'])

# View the average of the numeric features of each group
groups.aggregate('mean')
Applying multiple functions
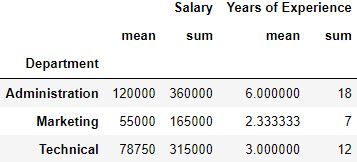
By passing a list of functions to the aggregate method, you can view multiple statistical values of a group at a glance.
# Separate the rows into groups that have the same department
groups = df.groupby('Department')

# View the sum and the average of the numeric features of each group
groups.aggregate(['mean', 'sum'])
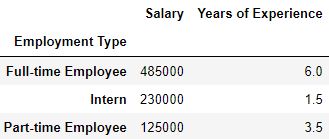
Applying different functions to different keys
It is not necessary to apply the same aggregation function on all the keys. You can also apply different functions on different group keys by using a dictionary. The keys of the dictionary will be group keys and the values of the keys will be the function to be applied on them.
# Separate the rows into groups that have the same employment type
groups = df.groupby(['Employment Type'])

# Compute the sum on the salary feature and the mean on the Years of Experience feature of the groups
groups.aggregate({'Salary': 'sum', 'Years of Experience': 'mean'})
2. Transformation
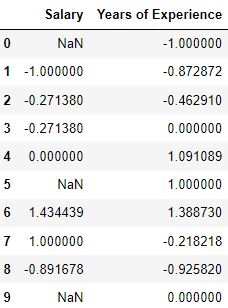
The transformation functions are used for making changes to the observations of each group. They can be used to apply important techniques such as standardization for scaling the observations of the group.
Use the transformation method to apply the transformation functions.
Note that the transformation functions:
- It will return an output with same size as the group chunk . Else, we will be able to broadcas the output to the same size as the group chunk.
- Operate on a column-to-column basis.
- We can’t use this for inplace operations. The groups formed must be considered to be immutable and applying transformation functions over them can yield unexpected results.
# Separate the rows into groups that have the same department
groups = df.groupby('Department')

# Define the transformation function to be applied
fun = lambda x: (x - x.mean())/x.std()

# Transform the groups
groups.transform(fun)
3. Filtration
If a data point or obaservation does not fullfill a certain criteria, we can filter them..
Use the filter method to apply the filtration functions.
# Separate the rows of the DataFrame into groups which have the same salary
groups = df.groupby('Salary')

# Filter out the groups whose average salary is less than 100000
groups.filter(lambda x: x['Salary'].mean() > 100000)

Other Useful methods and functions that often go with groupby
Let’s look at few more methods and functions available in the groups
The first method
We use this method to view the first observation of each group.
# Separate the rows into groups that have the same department
groups = df.groupby('Department')

# View the first observation of each group
groups.first()

The describe method
We use this method to display the statistical summary of the groups.
It is similar to the describe method of the pandas DataFrames.
# Separate the rows into groups that have the same department
groups = df.groupby('Department')

# View the statistical summary of the groups
groups.describe()

The size method
This method shows the number of observations present in each group
# Separate the rows into groups that have the same department
groups = df.groupby('Department')

# View the number of observations present in each group
groups.size()
Department
Administration    3
Marketing         3
Technical         4
dtype: int64
The nunique method
This method shows the number of unique observations in each feature of the groups.
# Separate the rows into groups that have the same department
groups = df.groupby('Department')

# View the number of unique observations in each feature of the groups
groups.nunique()

Renaming columns
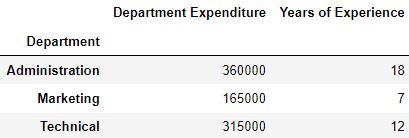
After applying a function, you can also rename the features of the groups by using the rename method to make them more descriptive.
This method requires a dictionary in which the keys are the original column names and the values are the new column names that will replace the original names.
# Separate the rows into groups that have the same department
groups = df.groupby('Department')

# Change the column name 'Salary' to 'Department Expenditure'
groups.aggregate('sum').rename(columns={'Salary': 'Department Expenditure'})
Practical Tips
- When you pass multiple group keys, only those rows whose group key values match with each other for all the group keys will be added in a group.
- Set the sort parameter as False for faster code execution.
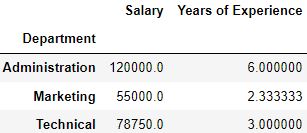
- You can chain the steps of grouping and applying a function to reduce the lines of code.
# Separate the rows into groups that have the same department and view the mean of the numeric features of the groups
df.groupby('Department').mean()
- Consider the case when we pass multiple group keys. Here, the order in which the group keys are passed affects both the multilevel index as well the observations of the groups.
# Pass the Department feature first and then Employment Type
print(df.groupby(by=['Department', 'Employment Type']).mean())

print('\n')
# Pass the Department feature first and then Employment Type
print(df.groupby(by=['Employment Type', 'Department']).mean())
                                     Salary  Years of Experience
Department     Employment Type
Administration Full-time Employee  120000.0                  6.0
Marketing      Intern               55000.0                  1.5
               Part-time Employee   55000.0                  4.0
Technical      Full-time Employee  125000.0                  6.0
               Intern               60000.0                  1.5
               Part-time Employee   70000.0                  3.0


                                     Salary  Years of Experience
Employment Type    Department
Full-time Employee Administration  120000.0                  6.0
                   Technical       125000.0                  6.0
Intern             Marketing        55000.0                  1.5
                   Technical        60000.0                  1.5
Part-time Employee Marketing        55000.0                  4.0
                   Technical        70000.0                  3.0
For more information, you can check pandas official documentation here.
Test Your Knowledge
Q1: NA values are dropped by default while making the groups. True or False?
Answer:Answer: True
Q2: How you can view the common group key value and the rows of the pandas DataFrame which are part of the same group?
Answer:Answer: Use a for loop to iterate through the groups and view the common group key value and the rows of the Dataframe which are part of the same group.
Q3: You have a DataFrame df that has two categorical columns col_1 and col_2 and a numeric column col_3.
Group the rows using the columns col_1 and col_2 and calculate the mean of the numeric features of the group.
Answer:groups = df.groupby(['col_1', 'col_2'])
groups.aggregate('mean')
Use this information to answer the following two questions. You have applied the groupby function on a DataFrame and stored the resulting groups in the variable groups.
Q4: Use a lambda function to transform the observations of the group by adding 10 to each observation.
Answer:Answer:
fun = lambda x: x+10groups.transform(fum)
Q5: Write the code to view the statistical summary of each group.
Answer:Answer: groups.describe()
This article was contributed by Shreyansh B and Shri Varsheni


