Menu

Python

How to use tf.function to speed up Python code in Tensorflow

tf.function is a decorator function provided by Tensorflow 2.0 that converts regular python code to a callable Tensorflow graph function, which is usually more performant and python independent. It is used to create portable Tensorflow models.       Introduction Tensorflow released the second version of the library in September 2019. This version, popularly called …

How to use tf.function to speed up Python code in Tensorflow Read More »

Tensorflow

TensorFlow vs PyTorch – A Detailed Comparison

Compare the popular deep learning frameworks: Tensorflow vs Pytorch. We will go into the details behind how TensorFlow 1.x, TensorFlow 2.0 and PyTorch compare against eachother. And how does keras fit in here. Table of Contents: Introduction Tensorflow: 1.x vs 2 Difference between static and dynamic computation graph Keras integration or rather centralization What is …

TensorFlow vs PyTorch – A Detailed Comparison Read More »

spaCy Tutorial – Complete Writeup

spaCy is an advanced modern library for Natural Language Processing developed by Matthew Honnibal and Ines Montani. This tutorial is a complete guide to learn how to use spaCy for various tasks. Overview 1. Introduction The Doc object 2. Tokenization with spaCy 3. Text-Preprocessing with spaCy 4. Lemmatization 5. Strings to Hashes 6. Lexical attributes …

spaCy Tutorial – Complete Writeup Read More »

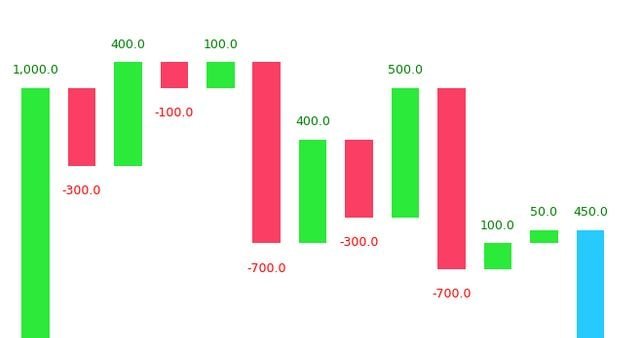
Waterfall Plot in Python

Waterfall Plot in Python

Waterfall chart is a 2D plot that is used to understand the effects of adding positive or negative values over time or over multiple steps or a variable. Waterfall chart is frequently used in financial analysis to understand the gain and loss contributions of multiple factors over a particular asset. Contents Introduction Simple Waterfall Plot …

Waterfall Plot in Python Read More »

Python JSON

Python JSON – Guide

JSON stands for JavaScript Object Notation. JSON is a lightweight data format used for data interchange between multiple different languages. It is easy to read for humans and easily parsed by machines. CONTENTS Brief Overview Purpose of JSON Serializing JSON dumps() function dump() function Deserializing JSON loads() function load() function Complex number encoding Complex JSON …

Python JSON – Guide Read More »

Matplotlib Line Plot – How to create a line plot to visualize the trend?

Line plot is a type of chart that displays information as a series of data points connected by straight line segments. A line plot is often the first plot of choice to visualize any time series data. Contents What is line plot? Simple Line Plot Multiple Line Plot in the same graph Creating a secondary …

Matplotlib Line Plot – How to create a line plot to visualize the trend? Read More »

Python Scatter Plot – How to visualize relationship between two numeric features

Scatter plot is a graph in which the values of two variables are plotted along two axes. It is a most basic type of plot that helps you visualize the relationship between two variables. Concept What is a Scatter plot? Basic Scatter plot in python Correlation with Scatter plot Changing the color of groups of …

Python Scatter Plot – How to visualize relationship between two numeric features Read More »

Requests in Python Tutorial – How to send HTTP requests in Python?

Requests is an elegant and simple Python library built to handle HTTP requests in python easily. It allows you make GET, POST, PUT and other types of requests and process the received response in a flexible Pythonic way. Contents Introduction to Requests Library What is a GET and POST request? GET Method Status Code Contents …

Requests in Python Tutorial – How to send HTTP requests in Python? Read More »

Matplotlib Pyplot – How to import matplotlib in Python and create different plots

The pyplot object is the main workhorse of matplotlib library. It is through pyplot that you can create the figure canvas, various types of plots, modify and decorate them. Contents Pyplot: Basic Overview General Functions in pyplot Line plot Scatter plot Pie chart Histogram 2D Histograms Bar plot Stacked Barplot Boxplot Stackplot Time series plotting …

Matplotlib Pyplot – How to import matplotlib in Python and create different plots Read More »

Python Boxplot – How to create and interpret boxplots (also find outliers and summarize distributions)

Boxplot is a chart that is used to visualize how a given data (variable) is distributed using quartiles. It shows the minimum, maximum, median, first quartile and third quartile in the data set. What is a boxplot? Box plot is method to graphically show the spread of a numerical variable through quartiles. From the below …

Python Boxplot – How to create and interpret boxplots (also find outliers and summarize distributions) Read More »

Bar Plot in Python – How to compare Groups visually

A bar plot shows catergorical data as rectangular bars with the height of bars proportional to the value they represent. It is often used to compare between values of different categories in the data. Content What is a barplot? Simple bar plot using matplotlib Horizontal barplot Changing color of a barplot Grouped and Stacked Barplots …

Bar Plot in Python – How to compare Groups visually Read More »

vector autoregression model feature image

Vector Autoregression (VAR) – Comprehensive Guide with Examples in Python

Vector Autoregression (VAR) is a forecasting algorithm that can be used when two or more time series influence each other. That is, the relationship between the time series involved is bi-directional. In this post, we will see the concepts, intuition behind VAR models and see a comprehensive and correct method to train and forecast VAR …

Vector Autoregression (VAR) – Comprehensive Guide with Examples in Python Read More »

Mahalanobis Distance Feature

Mahalanobis Distance – Understanding the math with examples (python)

Mahalanobis distance is an effective multivariate distance metric that measures the distance between a point and a distribution. It is an extremely useful metric having, excellent applications in multivariate anomaly detection, classification on highly imbalanced datasets and one-class classification. This post explains the intuition and the math with practical examples on three machine learning use …

Mahalanobis Distance – Understanding the math with examples (python) Read More »

Course Preview

Machine Learning A-Z™: Hands-On Python & R In Data Science

Free Sample Videos:

Machine Learning A-Z™: Hands-On Python & R In Data Science

Machine Learning A-Z™: Hands-On Python & R In Data Science

Machine Learning A-Z™: Hands-On Python & R In Data Science

Machine Learning A-Z™: Hands-On Python & R In Data Science

Machine Learning A-Z™: Hands-On Python & R In Data Science